Perceptual Map and Mapping (PERMAP)

Perceptual Map: this article explains the Perceptual Map in a practical way. The article starts with a general definition and explanation of the PERMAP, followed by a list of reasons why managers and organisations in general should use this tool to understand their competitive environment. Next, you will find information about its dimensions and a practical example.
The next paragraph explains how Perceptual Mapping is valuable for organisations in different contexts, but especially for measuring customer perceptions. A step-by-step process is also included, in order for you to get started using this method in practice. And to make it easier for you we also included a Perceptual Map template. Enjoy reading!
What is a Perceptual Map?
Definition
A Perceptual Map (PERMAP) is a diagrammatic technique used by marketers to visualise (potential) customers’ perceptions and opinions about products, product lines or brands. A perceptual map can also be used to represent a company’s situation relevant to the competition.

The word perceptual comes from the word perception, which refers to the consumer’s knowledge of the competitive products on the market with the accompanying attributes.
In some sources, perceptual maps are called positioning maps. In fact, these two have the same meaning for marketing purposes.
The use of two determinants, represented on the X and Y axes of a graph, is often used as a presentation format for marketing teams. Sometimes, however, other formats are used.
Why use it?
An important part of companies’ business operations is to understand customers as well as the competitors. This is crucial to success. A perceptual map helps companies do so. There are several reasons to use these maps, including:
- It helps to understand the thoughts and behaviour of the consumers
- It provides a simple presentation of the competition’s position compared to your company
- It helps to gain insight into new market trends
- It helps to identify gaps
- It helps to assess how the perception of a brand or product evolves with new launches or campaigns
- It helps to identify positioning preferences
- It helps to identify opportunities for repositioning
Use Perceptual Maps for:
- Environment scans
- Marketing strategies, positioning strategies
- Informing of perceptions
- Following presentations of new products
- Identifying the scope of damage to products that are past their peak
- Regular assessment of market changes to determine new trends
Two dimensions
A random number of dimensions can be included in a Perceptual Map, but the most common are the two dimensions quality and price. When looking at different cars, the PERMAP can provide insight into the consumers’ perception of the dimensions luxury/regular and expensive/affordable.
The positioning of a brand is strongly influenced by these customer perceptions. The customer’s perception of a product or service can be completely different than the company’s perception of the product or service they sell.
A company might believe they sell high-quality products at a good price, but if customers are not as positive about the quality, this perception will impact the sales numbers.
By plotting these perceptions in a multidimensional perceptual map, the position of a product or brand relevant to the competitor can be displayed. Companies have different methods at their disposal to acquire the different perceptions of customers about their product.
One of these is market research. This will help the company to discover how customers perceives the brand in relation to others in the same market.
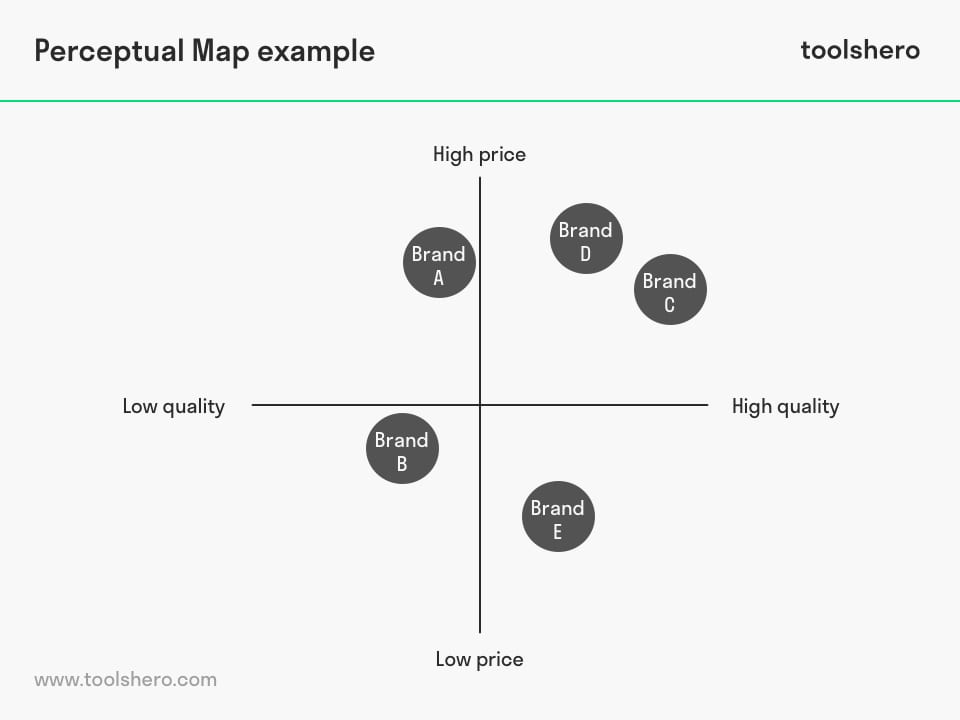
Figure 1 – Perceptual Map example
Using the Perceptual Map (PM)
The use of a Perceptual Map has lots of advantages for companies. First, it enables companies to truly understand their customers. Who are my customers? What are my customers’ preferences? Why does my customer choose my product over the competition? If perceptual mapping shows a company that its customers have an unfavourable view of the company, they can further investigate why.
Additionally, perceptual mapping also provides information on how customers view competitors’ products. Regularly using these maps can help to track the customer’s preferences and respond to new trends and developments.
Perceptual mapping is also effective for the marketing department in defining market segments.
The various clusters of companies are displayed and distinguished by key aspects such as quality and price. Another application for marketing purposes is monitoring the perceptions of a newly launched product or service.
Competition
Computers that are close together in perceptual mapping are comparable in terms of price and quality in the eyes of the consumer. This gives a company a good idea of its immediate competitors and, when inputting a new model, they should look for a field within the perceptual map that is far from the competitors.
The combinations of different dimensions makes a perceptual map more complicated, but this does clarify to a company where it could conquer a market share.
Focus areas for perceptual mapping
A perceptual map can also represent the ideal focus areas that a consumer expects of a product.
When a company considers marketing a new product, it will therefore first look at the fields with the highest density of ideal focus areas.
In combination with the perception fields, a company immediately knows what the competition is aimed at.
Intuitive perceptual mapping
A perceptual map can also be based on intuitive opinions and assessments of the marketer himself. The marketer’s decisions are then based on his experience of and insight into the sector.
In such a case, it’s unclear how valuable and objective perceptual mapping is. Methodological problems may arise in detailed market research, but the information does come directly from the consumer.
Different approaches
Different statistical procedures can be used in creating a perceptual map in order to gather and map raw data. It’s preferable that dimensions are used, but also multidimensional scales and ideal focus areas can provide insight into a company’s competitive position.
Additionally, statistical methods such as factor analysis, discriminant analysis, cluster analysis and logit analysis are used.
Here, some techniques are based on perceived differences between products and others on perceived similarities.
Limitations Perceptual Map (including an example)
Perceptual Map is a good basic tool for positioning purposes but also has lots of limitations. The most important one is the number of variables that is used. Traditionally, the map is based on two variables and doesn’t take others into account. This could hinder the reliability of the results.
Sometimes, it doesn’t make sense to only consider two important factors. Often, there are many more factors that influence a consumer’s decision to buy.
For example, a Perceptual Map (PM) with restaurants could be based on prices and quality, but fails to take other relevant variables into account, such as locations, visitor numbers, etc.
Another clear disadvantage of PM concerns what a company can offer and what the consumer thinks the company can offer.
This could be caused by miscommunication, impact of social media, etc. These falsehoods can influence the eventual result of the map, creating a distorted idea.
Another limitation of this method is the data collection method. A realistic development of a perceptual Map (PM) necessitates a huge amount of data. These data are usually obtained through questionnaires or other quantitative research methods, and are generally difficult to obtain.
Building your Perceptual Map: example
Follow the step-by-step plan below to develop your own Perceptual Map (PM). In the step-by-step plan below, we use the market of gingerbread as an example. The time to build such a map depends on factors such as the number of brands that have to be included.
Step 1: select attributes
First, the attributes must be established. These are crucial attributes a consumer includes in his or her decision whether or not to purchase a product or service. These attributes are always important to customers because they help them choose from the competitive offer in the market.
The most suitable crucial attributes depend on the subject of the study, read product or service. In this case, we look at gingerbread.
Suitable attributes would be flavour and health. Flavour is somewhat subjective, but it can be measured by means of qualitative research methods. Health can be established by the number of kcal or sugars per 100 grams of gingerbread, for instance.
Step 2: develop and distribute questionnaires
To build a full data set for developing the map, a questionnaire must be issued to a population relevant to the market and the research. Developing and managing such a questionnaire can easily be carried out with certain online tools.
In the gingerbread example, it’s important to ask questions to obtain information on the flavour and nutritional values of gingerbread offered by competitors in the breakfast foods market.
Step 3: calculate scores
In the third step, it’s time to start analysing and calculating reaction data. Pay special attention to the differences in how respondents think about how the competition is offered.
These data often come in the shape of qualitative data of closed-ended and open-ended questions in the questionnaire.
In these cases, it’s essential to make a numerical scale. Use a method such as the Likert Scale, for instance. This can be used to analyse long responses and subsequently assign numerical values to these.
Step 4: complete the Perceptual Map
Now that all the data is known, it’s time to make the perceptual map and place the brands in the quadrants.
Traditionally, the X-axis represents the nutritional value and the Y-axis represents the customer’s perception about the flavour. Once the brands and products have been mapped, the perceptual map is complete and a clear picture has emerged.
Perceptual Map template and worksheet
To set-up your Perceptual Map, you can use this ready-to-use template / worksheet in a .DOC format.
Download the Perceptual Map template
This template is exclusively for our paying Toolshero members. Click here to see if a membership is something for you!Perceptual Map Summary
A Perceptual Map (PM) is a diagrammatic visualisation of consumers’ perceptions of a certain brand or product. A company’s situation relevant to another company can also be represented. In that case, this is referred to as a positioning map.
In general, the Perceptual Map consists of two dimensions of the X-axis and Y-axis.
Plotting consumers’ perceptions on these axes helps a company to better understand its customers. What does my competition look like? Why does my customer choose my product over the competitor’s? These are important questions that must be answered to monitor the development of the customer’s behaviour and preferences.
A Perceptual Map (PM) is fairly easy to make, but also has a few shortcomings. First, crucial attributes must be established, based on which a product or service is evaluated. These are important because it helps these customers choose from the offer on the market.
Subsequently, questionnaires must be developed and distributed to obtain the required information. This information is analysed, quantified and then plotted on the Perceptual Map (PM).

It’s Your Turn
What do you think? Is Perceptual Mapping / PERMAP ‘s applicable in today’s modern economy and marketing? Do you recognize the practical explanation or do you have additions? What are your success factors for a good product / brand Analysis?
Share your experience and knowledge in the comments box below.
More information
- Dowling, G. R. (1986). Managing your corporate images. Industrial marketing management, 15(2), 109-115.
- Fodness, D. D., & Milner, L. M. (1992). A perceptual mapping approach to theme park visitor segmentation. Tourism Management, 13(1), 95-101.
- Kim, D. J., Kim, W. G., & Han, J. S. (2007). A perceptual mapping of online travel agencies and preference attributes. Tourism management, 28(2), 591-603.
- Ritchie, J. R. (1975). On the Derivation of Leisure Activity Types–A Perceptual Mapping Approach. Journal of Leisure Research.
How to cite this article:
Van Vliet, V. (2010). Perceptual Map (PERMAP). Retrieved [insert date] from Toolshero: https://www.toolshero.com/marketing/perceptual-map/
Original publication date: 06/07/2010 | Last update: 04/11/2024
Add a link to this page on your website:
<a href=”https://www.toolshero.com/marketing/perceptual-map/”>Toolshero: Perceptual Map (PERMAP)</a>
Ben Janse
Ben Janse is a young professional working at ToolsHero as Content Manager. He is also an International Business student at Rotterdam Business School where he focusses on analyzing and developing management models. Thanks to his theoretical and practical knowledge, he knows how to distinguish main- and side issues and to make the essence of each article clearly visible.

Related ARTICLES

Core Competence Model (Hamel and Prahalad)

PMESII-PT Analysis, an army Theory explained


Eight Dimensions of Quality by David Garvin