Fishbone Diagram by Kaoru Ishikawa explained

Fishbone Diagram: this article explains the Fishbone Diagram or Ishikawa Diagram by Kaoru Ishikawa in a practical way. After reading you will understand the basics of this powerful problem solving tool and Cause and Effect Analysis. This article also contains a downloadable and editable Fishbone Diagram template. Enjoy reading!
What is a Fishbone Diagram / Ishikawa Diagram?
Problems are the consequence of one or more root causes. By finding and removing the root causes, problems can be solved. Brainstorming sessions could identify possible root causes, but this is not a systematic manner.
By using a this diagram, it is possible to perform an extensive cause and effect diagram analysis and identify the root causes of problems. A frequently used alternative to this diagram is mind mapping.

Origin
This root cause analysis method was developed by Kaoru Ishikawa, a Japanese scientist, who discovered through his work at Kawasaki Heavy Industries, that a large number of contributing factors could influence a work process. Therefore, it is advised to use this method with the people who have the most knowledge about the work process. Include people like team members and managers.
To obtain insight into these factors, he designed a simple graphical tool, in which the potential root causes are represented in an orderly fashion.
As this root cause analysis model resembles a fishbone, the Ishikawa diagram is, also called the Cause and Effect Analysis. Actually, the diagram was intended for production processes and its accompanying quality control. Today, the Ishikawa diagram is also used in other sectors.
Create a Fishbone Diagram
The Fishbone Diagram makes a distinction between cause and result. On the right-hand side of this diagram, the head of the fish, the problems are identified and described and on the left-hand side the possible root causes are denominated. These root causes are subdivided into four categories. Subsequently, each category is branched into secondary causes.
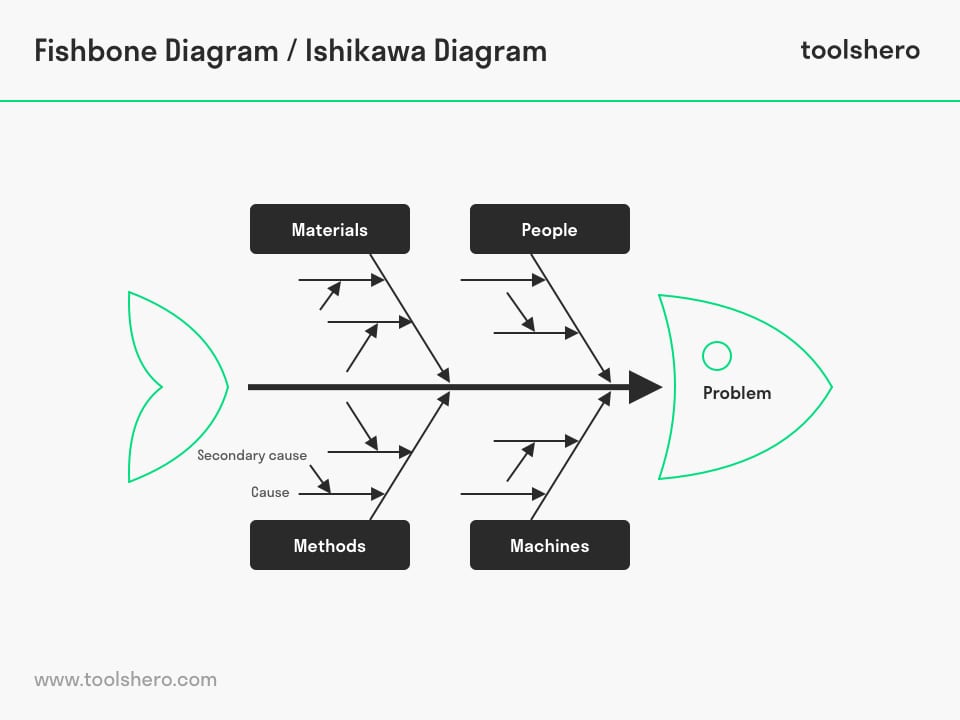
Figure 1 – an example of a Fishbone Diagram
The four main categories are:
People
This concerns all causes that are created by human actions; is there good communication, do people understand their assignments, are the employees sufficiently involved, experienced and trained, etc.?
Machines
This concerns causes related to the functioning of machines, tools, installations and computers; have the correct machines been used, are the machines safe enough, do the machines meet the requirements, are they reliable, etc.?
Materials
There may be problems with the materials, raw materials and consumables and semi-finished products; what is the quality, how much do we need, are the materials resistant to external influences, how long will they last, etc.?
Methods
This category investigates whether possible causes can be found in the work method; are the work processes adequate; how are the cooperative arrangements organized, how do employees and departments communicate with each other, etc.?
Details of the Fishbone Diagram
The Fishbone Diagram takes shape by following a number of steps. It starts with a large piece of paper on which a fishbone is drawn.
From there the following steps come up for discussion:
- The problem, in which the analysis is to be performed, is written at the top of the paper.
- Each participant mentions one possible cause for the problem and states in which category the problem belongs. No comments may be made on each other’s causes. All the listed causes are included in the Fishbone Diagram.
- The participants also mention possible secondary causes. These secondary causes are entered as branches in the Fishbone Diagram.
- This process is continued until no more possible causes are mentioned.
- The diagram is critically studied by all participants. They will see whether the possible causes have been entered in the right category and / or whether certain causes are related or derived from other causes.
- There is a vote on the most likely causes. The causes with the most votes will be turned into a “top 3” of possible causes. These three causes are circled. The causes without a vote are deleted.
- The priority order is determined from the “top 3” causes. The possible cause with the highest priority will be investigated further and then dealt with. After this the second and third causes will be addressed.
Adjustment
The diagram is an excellent root cause analysis and problem solving tool that can be used in any sector. As sectors can differ tremendously from one another it is possible to extend or change the root cause categories.
A technical company many want to add an IT category to the category “machine”. An advertising agency can insert a “creativity” category. As long as the root causes of problems are identified, the fishbone diagram has achieved its objective.
Useful tips for success
- Make sure that there is consensus in the group about both the need and the characteristics of the cause statement before beginning the process of building the Fishbone Diagram.
- If appropriate, you can “graft” branches that do not contain a lot of information on to other branches. Likewise, you can split branches that have too much information into two or more branches as you go.
- Make parsimonious use of words while populating the Ishikawa diagram. Only use as many words as necessary to describe the cause or effect.
Fishbone Diagram template
Start with the cause and effect analysis and identify the causes of problems with this ready to use Fishbone Diagram template.
Download the Fishbone Diagram template
This template is exclusively for our paying Toolshero members. Click here to see if a membership is something for you!
It’s Your Turn
What do you think? How do you apply the Fishbone Diagram? Do you recognize the practical explanation mentioned above or do you have additional information which you would like to share? What are your success factors for a set up?
Share your experience and knowledge in the comments box below.
More information
- Behnam, B., & Alvelos, H. (2011). Exploring the Potential of Quality Tools in Tire Retreading Industry: a Case Study. International Journal of Engineering Science and Technology (IJEST), 3(6), 5337- 5345.
- Ilie, G., & Ciocoiu, C. N. (2010). Application of Fishbone Diagram to Determine the Risk of an Event with Multiple Causes. Management Research and Practice, 2(1).
- Gupta, K., Sleezer, C.M. & Russ‐Eft, D.F. (2007). A Practical Guide to Needs Assessment. Pfeiffer.
- Ishikawa K. & Loftus, J.H. (1990). Introduction to quality control. Tokyo, Japan: 3A Corporation; 1990.
How to cite this article:
Mulder, P. (2013). Fishbone Diagram (Ishikawa). Retrieved [insert date] from Toolshero: https://www.toolshero.com/problem-solving/fishbone-diagram-ishikawa/
Published on: 07/19/2013 | Last update: 04/03/2023
Add a link to this page on your website:
<a href=”https://www.toolshero.com/problem-solving/fishbone-diagram-ishikawa/”>Toolshero: Fishbone Diagram (Ishikawa)</a>
Related ARTICLES

DMADV Process: the Basics and Steps

Charles Kepner biography and books

Eight Dimensions of Quality by David Garvin

Agile Crystal Method explained