Risk Impact Probability Chart

Risk Impact Probability Chart: this article provides a practical explanation of risk impact probability chart. Next to what it is, this article also highlights what this chart shows, the combination with the risk impact analysis and risk mitigation. After reading, you’ll understand the basics of this decision-making tool. Enjoy reading!
What are Risk Impact Probability Charts?
A Risk Impact Probability Chart is a tool used to visually display the results of risk and impact assessments.
It is an essential visual tool for risk management, and consists of several criteria. To understand how exactly this tool works, we must first understand what risk impact means and what risk probability means.

Risk probability refers to determining the probability of a risk occurring. This probability is generally based on historical information. Is there a certain frequency with which the problem occurs? When determining the probability of a risk, a score is usually assigned to the risk, such as 3, 2, 1. 3 represents a high risk, 2 an average risk, and 1 a low risk.
Impact assessment means assessing a risk’s impact if the risk were to become reality.
The central question is: if the risk were to occur, would this be catastrophic for the project or activity? Or would it be a minor inconvenience? An effect assessment is usually carried out by the risk manager, and by the people who have the right knowledge to estimate the risks and establish the impact. The impact assessment is also assigned a score of 3, 2 or 1.
What shows a Risk Impact Probability Chart?
The Risk Impact Probability chart shows whether a risk has a high chance of occurring and what the impact of the risk is when does occur. The graph above represents these two criteria on the x and y axis.
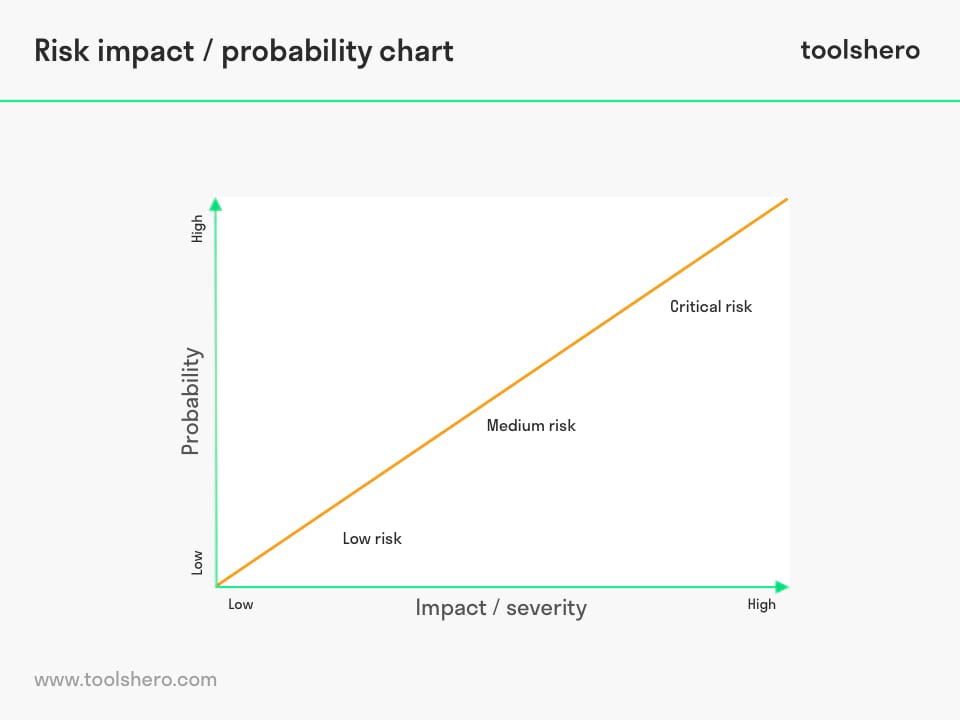
Figure 1 – an example of a Risk Impact Probability Chart
The risk categories below can be deduced from the graph. These are subsequently assigned a colour and are added to the risk matrix.
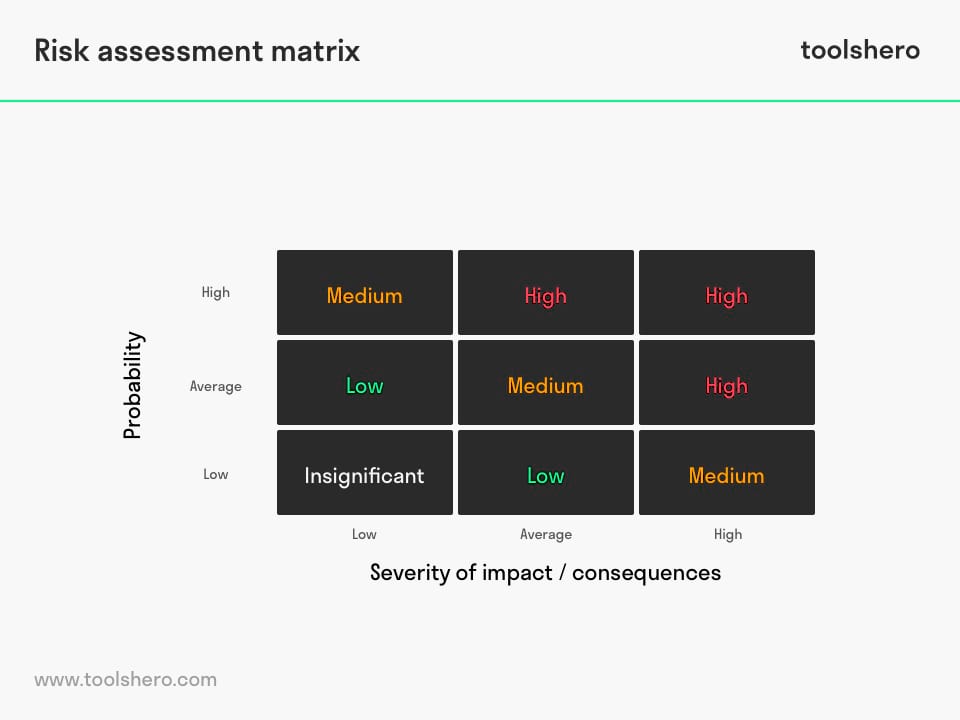
Figure 2 – Risk Assessment Matrix
High Impact / High Probability
The top right contains the risks that have a high impact, and that will most likely happen. In the Risk Impact Probability chart, or risk matrix, this group of risks is usually denoted with a red colour.
High Impact / Low Probability
A risk with a potentially high impact but a small chance of the risk coming true, is denoted with the colour orange. Different responses befit the various types of risks. The various responses to risks are explained in the next chapter.
Low Impact / High Probability
The risks with a low impact but high probability are medium risks. These risks are often given the colour orange in the matrix. The probability that the risk occurs is high, but the impact the risk will have is most likely small.
Low Impact / Low Probability
The bottom left displays the Risk Impact Probability charts that have a low impact and that are unlikely to happen due to the small chance.
In many situations, the risks in this category are indicated in green and immediate action is not called for.
Risk Impact Probability Chart and risk mitigation
Different reactions are possible to the displayed risks in the risk impact / probability chart. Sometimes, running a risk is not as bad as it sounds and it’s simply accepted.
In case of a risk that could halt the entire production line of a company, for instance, adequate response is required to limit the damage. Risks can be approached in one of four ways.
Accepting the Risk
The first option is to respond to a risk by accepting the risk as it exists and refraining from any action. This strategy is often used for risks with a low impact or a low probability.
In many organisations, budget is reserved to act in such situations. Risks that will not occur until later are also often placed in this category.
Risk Reduction
Reducing or mitigating the risk is a different risk response that can be deployed. Reducing the risk means taking action to reduce the probability or impact of a risk.
Risk reduction is used in practically every situation in daily life. For example, we wear seatbelts in the car. This does not reduce the chance of getting into an accident, but it does reduce the negative impact of a crash.
Risk Transference
Another possible response to a risk is transferring the risk. By transferring the risk, the risk is not reduced but rather transferred to a third party.
A common risk transference method is to take out insurance. Production companies that depend on certain raw materials could also ‘protect’ themselves to prevent higher costs for raw materials.
Risk Avoidance
Another risk response is to cover every possibility of the risk becoming a threat.
Companies often choose this option when the risk has consequences for employees’ safety, is in violation of the law, or when it forms a threat for the organisation as a whole. An example of risk avoidance is to halt a production line, selling or reorganising part of the company, or expanding abroad.
Technically, all risks are accepted, apart from those that are completely avoided. When transferring the risk, the risk still exerts an impact and the impact is also still present in reduced risks.
Risk Impact Probability Chart: risk impact analysis
Before certain developments are marked as risks, it is established what the impact of this development will likely have, and whether it truly poses a risk to others. Risk impact assessment, or risk impact analysis, is the process in which developments are assessed based on probability and consequences.
The results of this analysis are subsequently used to prioritise the identified risks, and to add the risk to the risk impact probability chart. Categorising these risks supports the manager, since he/she is able to deploy various resources in response to the risks based on this categorisation.
Aligning Criteria
When assessing a risky event or development, it is important to align the criteria with the project or decision. For this purpose, use as many techniques and tools as possible for the specific type of analysis.
Frequently used criteria in the business world include technical performance, costs, planning, and more.
Document Rationale
It is essential to carefully document the justification or rationale for each risk effect. When doing so, document the reason for the probability and impact assessment.
If the circumstances or environment subsequently change, the assessment can be re-evaluated. The rationale helps to communicate the meaning of a certain abstract risk to the stakeholders.

Now It’s Your Turn
What do you think? Are you familiar with the explanation of the Risk Impact Probability chart? Do you use such graphs to categorise risks? Which other tools for risk management do you know? What do you believe are pros and cons of this decision-making tool?
Share your experience and knowledge in the comments box below.
More information
- Dumbravă, V., & Iacob, V. S. (2013). Using probability–impact matrix in analysis and risk assessment projects. Descrierea CIP /D escription of CIP–Biblioteca Națională a României Conferința Internațională Educație și Creativitate pentru o Societate Bazată pe Cunoaștere–ŞTIINŢE ECONOMICE, 42.
- Hillson, D. (2002). Extending the risk process to manage opportunities. International Journal of project management, 20(3), 235-240.
- Ni, H., Chen, A., & Chen, N. (2010). Some extensions on risk matrix approach. Safety Science, 48(10), 1269-1278.
- Miller, K. D. (1992). A framework for integrated risk management in international business. Journal of international business studies, 23(2), 311-331.
How to cite this article:
Janse, B. (2019). Risk Impact Probability Chart. Retrieved [insert date] from Toolshero: https://www.toolshero.com/decision-making/risk-impact-probability-chart/
Original publication date: 11/18/2019 | Last update: 09/29/2023
Add a link to this page on your website:
<a href=”https://www.toolshero.com/decision-making/risk-impact-probability-chart/”>Toolshero: Risk Impact Probability Chart</a>
Ben Janse
Ben Janse is a young professional working at ToolsHero as Content Manager. He is also an International Business student at Rotterdam Business School where he focusses on analyzing and developing management models. Thanks to his theoretical and practical knowledge, he knows how to distinguish main- and side issues and to make the essence of each article clearly visible.

Related ARTICLES

DMADV Process: the Basics and Steps

Charles Kepner biography and books

Eight Dimensions of Quality by David Garvin

Agile Crystal Method explained