Current Ratio: Meaning, Formula and an Example

Current Ratio: this article explains the Current Ratio in a practical way. The article starts with the general definition and meaning of the current ratio, followed by the formula that belongs to it, and a practical example. You will also find practical tips to get started with calculating the current ratio for your organisation. Enjoy reading!
What is the Current Ratio? The meaning
The current ratio (CR) is a calculation formula and liquidity indicator that indicates to what extent an organization can repay current liabilities with short term assets. This ratio is also known as liquidity ratio or cash solvency ratio.
Current Ratio formula
The formula for calculating is as follows:
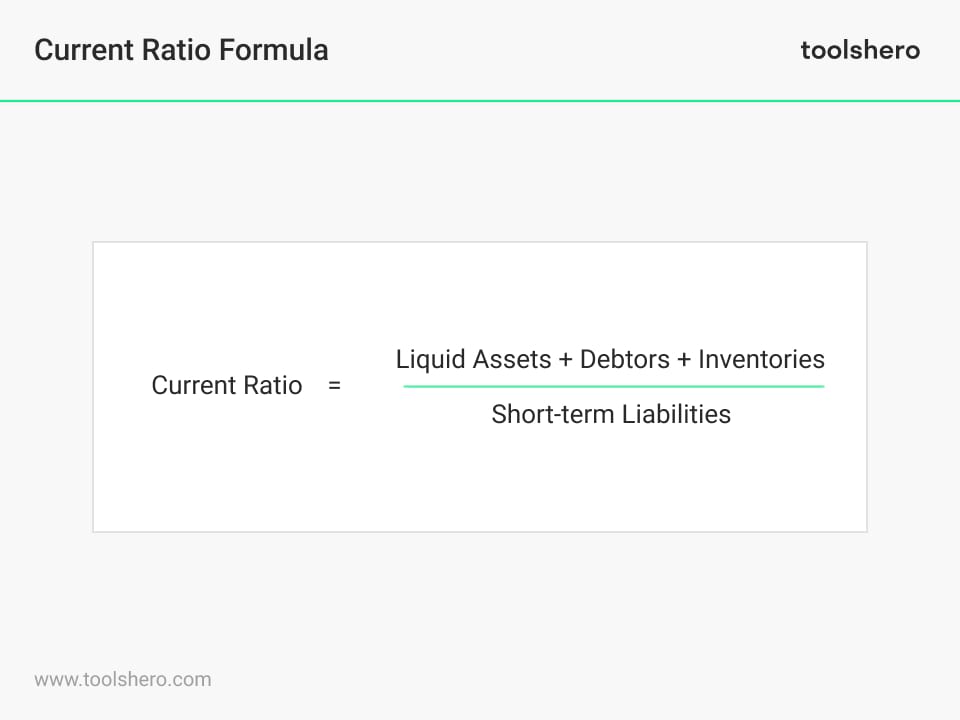
Figure 1 – Current ratio formula

* = Liquid assets are resources that are readily available such as cash and money in bank accounts. Inventories are the products times (x) the cost price that are managed in the warehouse.
** = Short Term Liabilities is the capital that has to be repaid within a short time for example a supplier’s credit, creditors or an overdraft facility.
The outcome of this ratio is often used to form an idea of the organization’s capital. It is about short-term obligations (liabilities) that can be repaid with short-term assets (cash, inventories, receivables).
Rule of Thumb: the higher this ratio is, the better the organization is able to repay their short-term liabilities.
If the outcome is lower than one, this indicates that the organization is unable to meet its short-term liabilities. This says something about the organization’s financial health, but that does not necessarily mean they are going bankrupt.
This ratio can say something about the efficiency of an organization with respect to turning over products into cash.
Liquidity problems may arise because of long-term outstanding debts, stock management or problems with the bank. A ratio of less than 1 indicates that an organization’s debts exceed its assets within a given period. That may seem like a problem, but sometimes there are various reasons for a negative ratio.
Example
For example, a company’s cycle of collections and payment processes may cause the company to have a high ratio when receiving the payments, but a lower ratio when these collections and payments decrease. The ratio is therefore a snapshot, which may indicate that the company cannot cover all debts at that specific moment, but perhaps it can at a time when no customer payments are due.
The higher the ratio, the better the company is able to meet its obligations. A ratio that is too high, for example more than 3, can also indicate that the company cannot optimally use current assets, or that it cannot properly arrange financing.
A complete picture only emerges if the ratio is determined repeatedly over several periods.
Example of the course of the current ratio
We have seen that the ratio is not always a good representation of a company’s financial situation. What makes the ratio good or bad depends largely on how it progresses.
In other words: how the relationship between assets and liabilities changes. A company that seems to have a good ratio may evolve into a situation where it has the greatest possible difficulty in paying the bills. Conversely, a company with a lower ratio can take good steps towards a healthy ratio.
The trend of an ever-decreasing ratio can strongly influence a company’s valuation. A reverse trend may indicate the opportunity to invest in an undervalued stock during a switch.
Consider the example of two companies with a ratio of 1.00 today. Which company would analysts have a more optimistic outlook for?
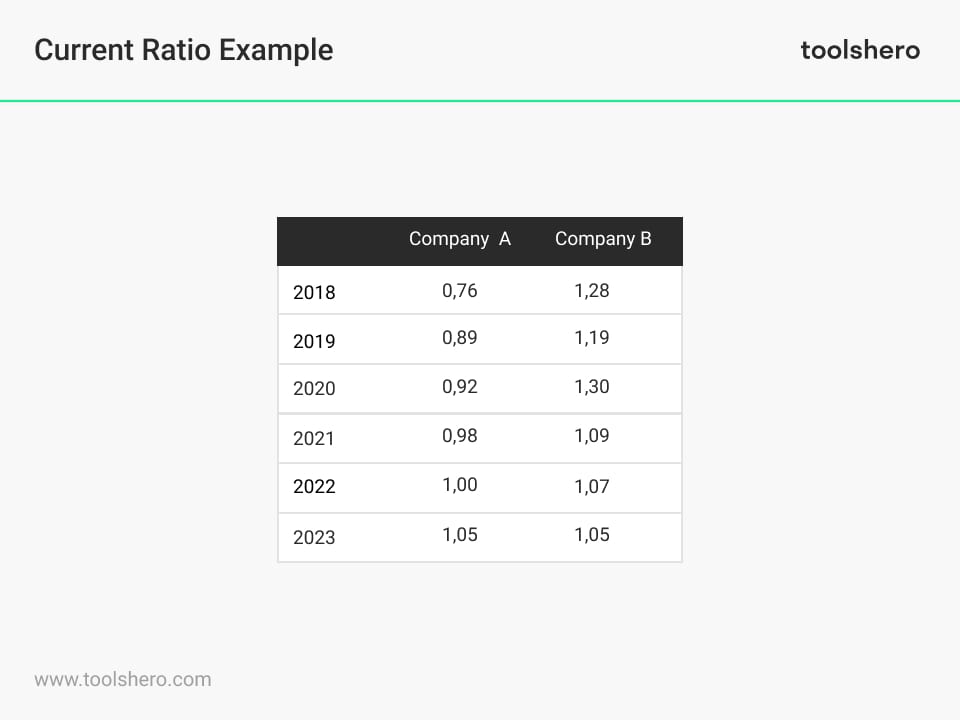
Figure 2 – Current Ratio calculations
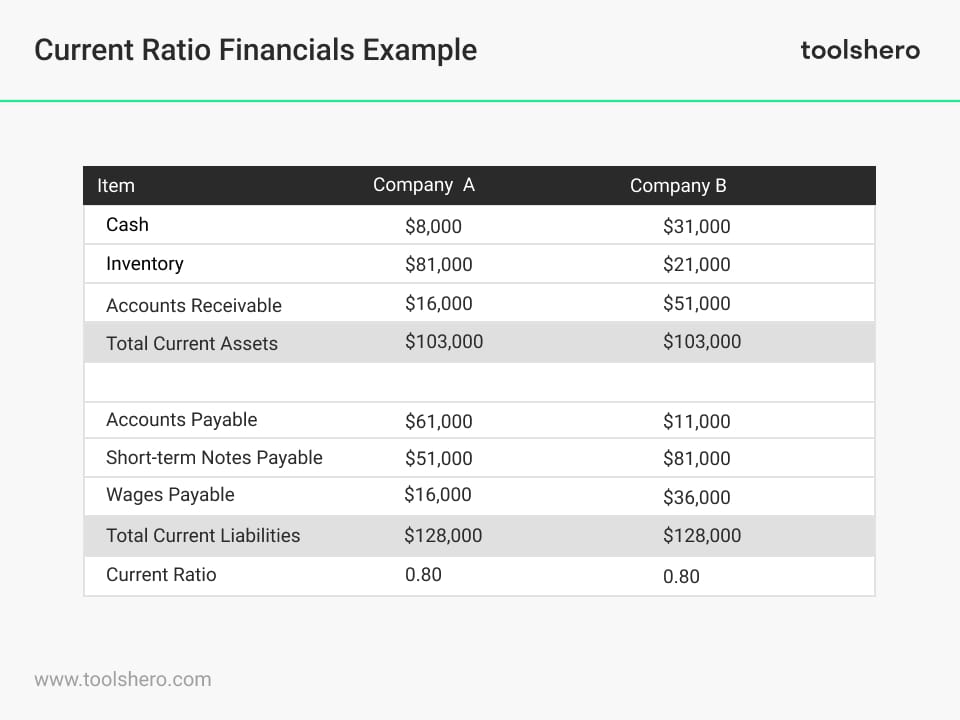
Figure 3 – Company A versus B, the financials
Two things stand out in the trend of Company A versus Company B. The trend for Company A is negative. That means doing further research is prudent. It could be that this company takes on more debt or that the cash balance becomes depleted. Both can pose a problem for solvency if the situation deteriorates.
The trend for company B is positive. This may indicate better collections, faster inventory turnover or that the company has been better able to pay off debt.
The second thing to note is that Company B’s ratio has been more volatile, with a big jump between the year 2020 and 2021. This may indicate increased risk and major pressure on the company’s value.
Limitations
One of the limitations of this ratio comes to the surface when the method is used to compare different companies. Companies differ considerably from each other, especially in different sectors. Comparing the ratios of these companies may not lead to any useful insight.
In one industry it may be customary to give customers 90 days for their payment, while in another industry the collection follows very quickly. It is therefore better to compare companies within the same industry and with the same rules.

Now it’s your turn
What do you think? Is the Current Ratio still applicable in today’s modern economy and business world? Do you recognize the practical explanation or do you have more suggestions? What are your success factors for using financial ratios in relation of good business management?
Share your experience and knowledge in the comments box below.
More information
- Bates, T. W., Kahle, K. M., & Stulz, R. M. (2009). Why do US firms hold so much more cash than they used to?. The journal of finance, 64(5), 1985-2021.
- Berger, A. N., & Udell, G. F. (1995). Relationship lending and lines of credit in small firm finance. Journal of business, 351-381.
- Ross, S. A., Westerfield, R., & Jordan, B. D. (2008). Fundamentals of corporate finance. McGraw-Hill Education.
How to cite this article:
Van Vliet, V. (2012). Current Ratio. Retrieved [insert date] from Toolshero: https://www.toolshero.com/financial-management/current-ratio/
Original publication date: 01/09/2012 | Last update: 01/31/2024
Add a link to this page on your website:
<a href=”https://www.toolshero.com/financial-management/current-ratio/”> Toolshero: Current Ratio</a>
Vincent van Vliet
Vincent van Vliet is co-founder and responsible for the content and release management. Together with the team Vincent sets the strategy and manages the content planning, go-to-market, customer experience and corporate development aspects of the company.

Related ARTICLES

Internal Rate of Return: Definition and Calculation

Investment Management explained


Return On Investment (ROI): Formula and Calculation example