
DuPont Analysis explained

DuPont Analysis: this article provides a practical explanation of DuPont Analysis. This article contains a general definition of the method, the calculation and formula, a practical example and de pros and cons. After reading this, you will understand the basics of this financial management tool. Enjoy reading!
What is DuPont Analysis?
The DuPont Analysis, also known as the DuPont Identity, is a fundamental framework for performance assessment. It can be used to analyse the various factors influencing the returns that investors receive from the organisation.
This is also referred to as the Return on Equity: the ratio between the profits of a company and the capital used to achieve these profits. This business-economic analysis is a tool that can help accountants and financial managers to analyse a company’s profitability without drawing misleading conclusions.

The DuPont Analysis method breaks down and clarifies the different components of the Return on Equity (ROE) formula, which can help companies with finding ways to improve their return on equity. Organisations mostly use this method to improve their own performance and to increase the return that they can offer to investors and shareholders.
The DuPont Analysis got its name from the DuPont Corporation. This large, American company was founded in 1802 as a gunpowder mill by French-American chemist and industrial expert Éleuthère Irénée du Pont.
They developed several different polymers, including neoprene, nylon and Kevlar in the 20th century, and they became very well known in the chemical industry. The company currently has 33,000 employees and is ranked number 176 on the Forbes list.
How do you calculate DuPont analysis? The formula
The DuPont Analysis uses three interrelated components to calculate the Return on Equity (ROE). The breakdown into three distinct components makes it possible to establish which of the three components has the biggest impact on changes or fluctuations of the Return on Equity.
Despite the fact that the DuPont Analysis can be used to calculate the profitability of a company in relation to its assets, this isn’t the method’s main objective. The goal is to determine which factors influence the ROE, so that the Management knows which problems to address.
The formula used to calculate the ROE is as follows:
ROE = Profit Margin × Asset Turnover × Financial Leverage
The three components after the equals sign are important elements:
- Profit Margin: the difference between turnover and profits
- Asset Turnover: the difference between turnover and assets used
- Financial Leverage: the relationship between profitability and the costs of borrowed capital
To complete the above formula, you need to start with calculating the three separate ratios. These ratios can be calculated using data from the organisation’s balance sheet and income statement. You can find these financial management overviews in the financial part of an organisation’s annual report.
The brackets in the formula below demonstrate how both the ratios and the ROE are calculated:
ROE = (Net Income/Net Sales) × (Net Sales/Total Assets) × (Total Assets/Total Shareholders’ Equity)
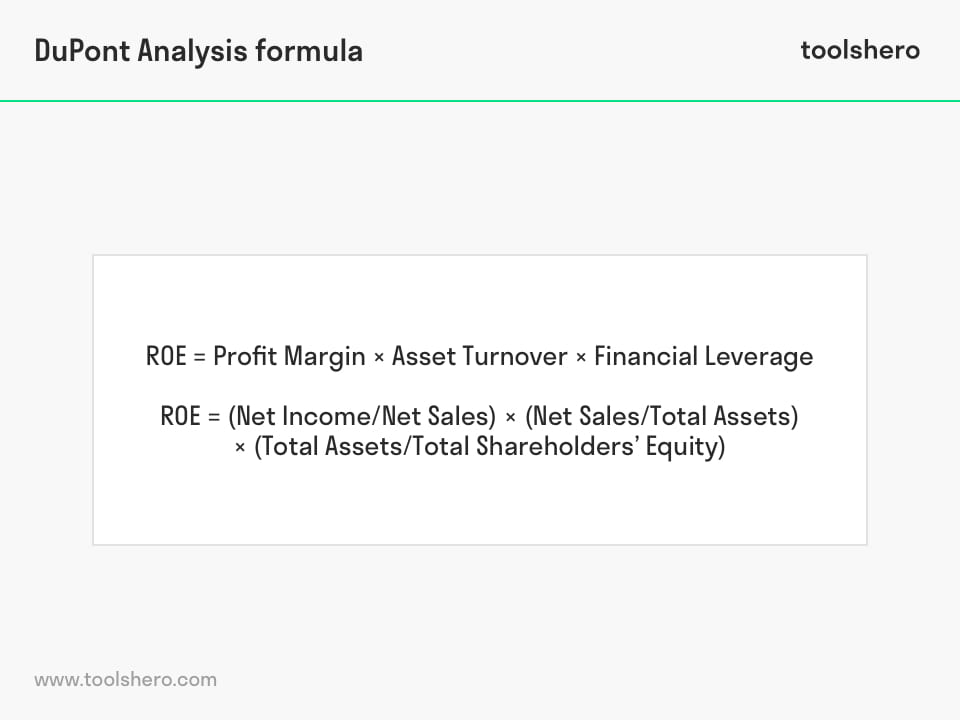
Figure 1 – The DuPont Analysis Formula
You can find all these details in the financial management overviews of the organisation, so you can simply copy them into the formula.
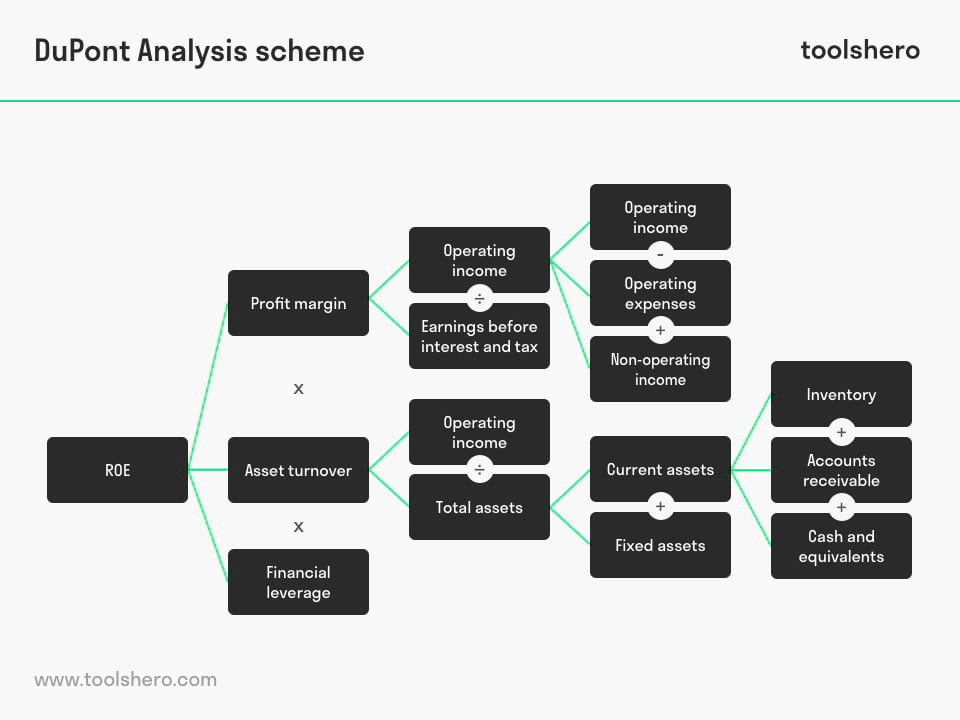
Figure 2 – The DuPont Analysis Scheme
DuPont Analysis example: Organisation X
The financial overviews of organisation X can be summarised as follows:
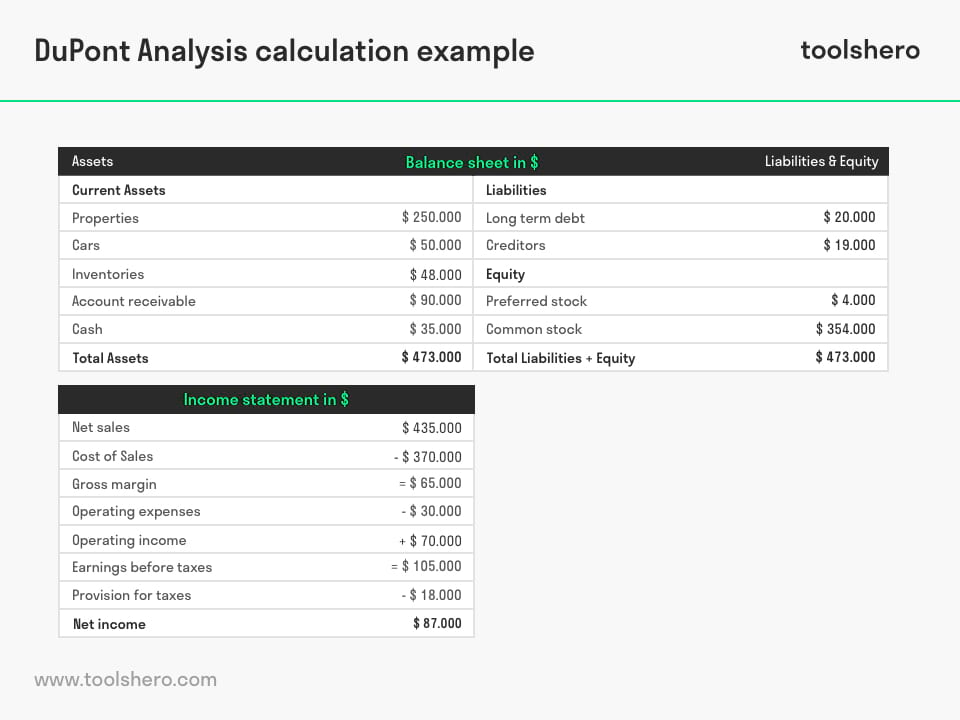
Figure 3 – DuPont Analysis Calculation Example
Organisation X has agreed to pay out 15,000 euros of dividends. Profit distributions should be distracted from the net income. Based on the details above, the three parentheses are calculated as follows:
- Profit Margin = (Net Income/Net Sales) = (87,000-15,000)/420,000 x 100% = 17.14%
- Asset Turnover = (Net Sales/Total Assets) = 420,000/473,000 = 0.89
- Equity multiplier = (Total Assets/Total Shareholders’ Equity) = 473,000/358,000 = 1.32 (Financial leverage)
Following the DuPont calculation, organisation X’s Return on Equity is: ROE = 17.14% x 0.89 x 1.32 = 20.14%
What does this ROE mean to investors and analysts?
Organisation X has a 20.14% ROE. This means that organisation X generates 0.2014 euro for each euro of their equity capital. For potential investors, this is an important number, because it shows how efficiently a company uses their money to increase their net income.
The average ratios covering around 5 to 10 years, provide quite a realistic image of an organisation’s development. Business growth or a higher ROE doesn’t necessarily imply that profits are distributed among shareholders. But they will eventually benefit from the value increase of the shares.
Business-economic analysts can use the DuPont method to analyse an organisation and establish what the company’s strengths and weaknesses are, and how they can improve, in an efficient way. Generally speaking, analysts feel that companies with an ROE of less than 12-14% are too high risk to invest in.
Investments in organisations with an ROE of 20% or more, are considered justified and solid investments. The profitability (ROE) of Apple Inc., for example, increased from 17.88% in 2005 to 36.07% in 2017. Investors are always told to be careful with organisations that have a negative ROE, as they are often confronted with problems related to excessive debts.
Pros and cons of the DuPont Analysis
- The DuPont Analysis is an excellent method if you want to get an understanding of a company’s strengths and weaknesses. Each individual weak financial ratio in the model can be analysed further in order to get more insight in the underlying reason for that weakness.
- If the calculation of the three components of the DuPont analysis reveals any weaknesses, the Management can take measures, such as improving their cost control, assets management or marketing. The objective of all these measures is to increase the return on equity ratio.
- A disadvantage of the DuPont Analysis is that the financial overviews that are used to calculate the ROE might have been manipulated in order to hide certain shortcomings. If you want to be sure that the outcomes are correct, you need to use accurate accounting data.
- Another disadvantage is inherent to all financial ratio analysis methods. Comparing an organisation’s profitability and efficiency with that of another organisation works best when the two companies have the same size and operate in the same industry.

It’s Your Turn
What do you think? Do you recognise the explanation about the DuPont Analysis? Could the DuPont identity help you get an understanding of the financial effectiveness of your organisation? Which factors do you think are needed for a realistic prognosis of a company’s profitability?.
Share your experience and knowledge in the comments box below.
More information
- Soliman, M. T. (2008). The use of DuPont analysis by market participants. The Accounting Review, 83(3), 823-853.
- Dehning, B., & Stratopoulos, T. (2002). DuPont analysis of an IT-enabled competitive advantage. International Journal of Accounting Information Systems, 3(3), 165-176.
- Daum, J. H. (2002). Beyond budgeting: a model for performance management and controlling in the 21st century. Controlling & Finance, 5, 33-34.
How to cite this article:
Janse, B. (2018). DuPont Analysis. Retrieved [insert date] from Toolshero: https://www.toolshero.com/financial-management/dupont-analysis/
Original publication date: 03/14/2018 | Last update: 08/20/2023
Add a link to this page on your website:
<a href=”https://www.toolshero.com/financial-management/dupont-analysis/”> Toolshero: DuPont Analysis</a>
Ben Janse
Ben Janse is a young professional working at ToolsHero as Content Manager. He is also an International Business student at Rotterdam Business School where he focusses on analyzing and developing management models. Thanks to his theoretical and practical knowledge, he knows how to distinguish main- and side issues and to make the essence of each article clearly visible.

Related ARTICLES

Internal Rate of Return: Definition and Calculation

Investment Management explained


One response to “DuPont Analysis explained”
yep, dupont is a framework for analyzing fundamental performance popularized by the DuPont Corporation.