Gross Margin

Gross Margin: this article explains the concept of Gross Margin. After assimilating it, you will be able to understand and calculate this important indicator.
What is a Gross Margin?
Gross Margin (GM) is a key indicator of the profit and loss statement. It shows the company’s earnings over a given period. In absolute value, this indicator measures the difference between the selling price and the cost price of a product or service.
As an essential element of the company’s profitability and competitiveness, this indicator is used as a basis for calculating the GM rate which allows, for instance, monitoring the evolution of the internal margins and compare it with the competitors’ margins rates (sector benchmarking).

Role of this indicator
Having a good GM is a prerequisite for a good profitability. Setting this per product is therefore a prerequisite for setting up a pricing policy. This should also include negotiating the procurement costs with the suppliers.
Calculating this margin rate of each of its products makes it possible to compare their contribution to the performance of the global business. Expressed as a percentage, this ratio corresponds to the margin rate.
Gross Margin Formulas
The head of the company can calculate its gross margin and its gross profit margin from items contained in the profit and loss account of his company.
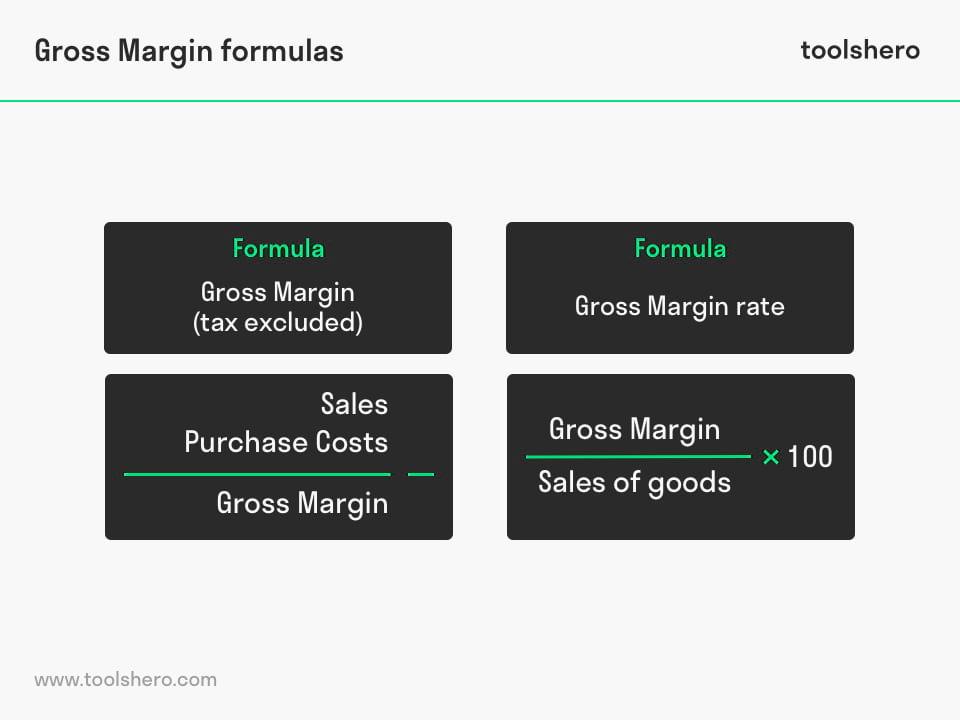
Here is the formula in absolute value:
Gross Margin = Sales (Tax excluded) – Purchase Costs (Tax excluded)
The cost of purchasing the goods sold is calculated from the purchase of goods and the inventory change.
And here is the formula for the gross margin rate (in percentage):
Gross Margin Rate = (Gross Margin / Sales of goods) x 100.
Gross Margin example
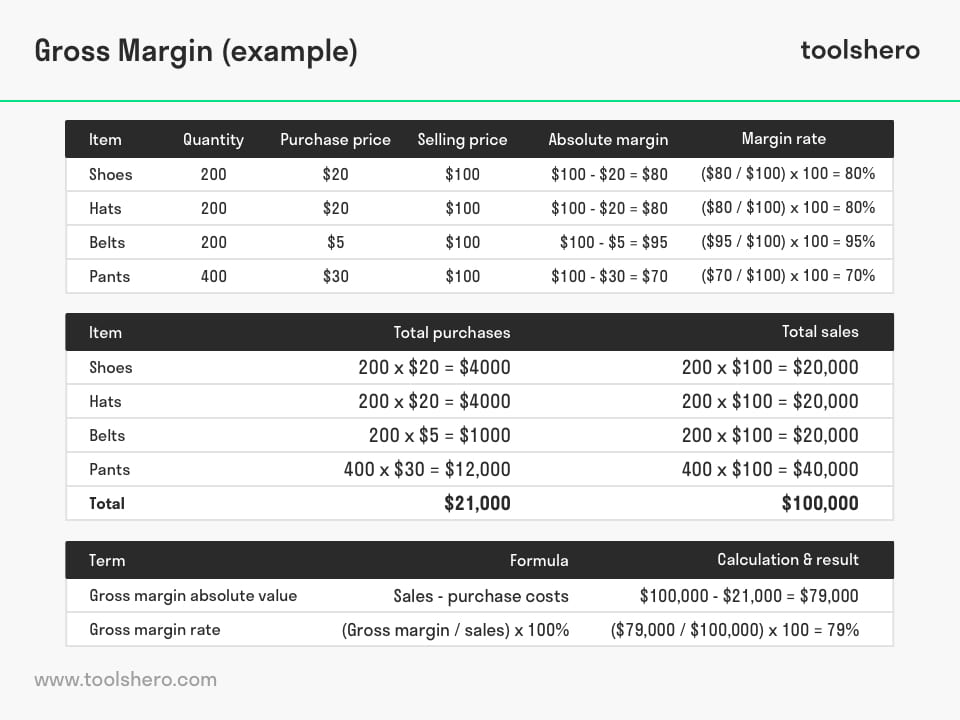
Over a given period, a trader bought a quantity of 1.000 articles and fashion accessories. All the indicated prices are excluding taxes.
- 200 shoes at the price of 20 € (per unit) that he sold for 100 € (per unit);
- 200 hats at the price of 20 € (per unit) which he sold for 100 € (per unit);
- 200 belts at the price of 5 € (per unit), which he sold for 100 € (per unit);
- 400 pants at the price of 30 € (per unit), which he sold for 100 € (per unit)
The GM of a shoe is 80 €: (100 € – 20 €), its GM rate is 80%: (80 € / 100 €) x 100; The Gross Margin of a hat is 80 € (100 € – 20 €), its GM rate is 80%: (80 € / 100 €) x 100; The GM of a belt is 95 € (100 € – 5 €), its GM rate is 95%: (95 € / 100 €) x 100. The GM of a pant is 70 € (100 € – 30 €), its GM rate is 70%: (70 € / 100 €) x 100.
The belt is the product with the highest Profitability for the trader because it has the highest GM rate.
From these elements, he can calculate his total gross margin over the period:
Sales = (200 x 100 €) + (200 x 100 €) + (200 x 100 €) + (400 x 100 €) = 20 000 € + 20,000 € + 20,000 € + 40,000 € = 100,000 €
Purchase price = (200 x 20 €) + (200 x 20 €) + (200 x 5 €) + (400 x 30 €) = 4,000 € + 4,000 € + 1,000 € + 12,000 € = 21,000 € (in order to simplify, we assume that there are no changes in the inventories).
GM in absolute value = total sales – total purchases = 100,000 € – 21,000 € = € 79,000
Gross Margin rate = (79,000 € / 100,000 €) x 100 = 79%
Benefits
The GM rate can be compared with the competitors in order to adjust the selling prices, for example. An entrepreneur whose GM rate is higher than those of his competitors can thus make the decision to reduce his selling prices to recover market share without too much penalizing his profitability. Internally, this ratio also allows to evaluate the growth of margin rates over the last 3 years.

It’s Your Turn
What do you think? How do you calculate your Gross Margin? Do you recognize the practical explanation or do you have more additions? What are your success factors for getting new insights on your profit and loss accounts?
Share your experience and knowledge in the comments box below.
More information
- Asghar, T.A. (2011). Driving the Growth of Gross & Operating Margins. Amazon Digital Services LLC.
- Lee, B. (2002). Gross Margin: 26 Factors Affecting Your Bottom Line. New Oxford Publishing Corporation.
- Quintreau, L. (2008). Gross Margin. Random House UK.
How to cite this article:
Jorio, N. (2017). Gross Margin. Retrieved [insert date] from toolshero: https://www.toolshero.com/financial-management/gross-margin/
Add a link to this page on your website:
<a href=” https://www.toolshero.com/financial-management/gross-margin/”>toolshero: Gross Margin</a>
Nawfal Jorio
Nawfal Jorio, MSc. is a Financial Analyst for a Belgian Public Investor. He is an expert in Financial Management, Business Planning and Banking. His expertises are Start-ups, SME's and the Non-profit sector.