AARRR Framework explained

AARRR Framework: this article provides a practical explanation of the pirate funnel / AARRR Framework. Next to what it is (definition and explanation), this article also highlights the different stages and metrics of the AARRR Framework and turnover, and practical tips. Enjoy reading!
What is the AARRR Framework?
The AARRR Framework is a tool to help assist companies to understand consumers better. The method is also known as pirate metrics, and was invented by Dave McClure.
AARRR is an acronym which stands for acquisition, activation, retention, referral, and revenue. These terms will be explained in the following sections of this article. Statistics are kept over the course of these various phases of the customer journey. The whole picture is fundamental to understanding the consumer.

AARRR is generally touted as the method with the five best statistics to keep for a start-up. That is due to the fact that these statistics effectively measure the growth of a company and simultaneously are simple and easy to use.
Pirate Funnel metrics
The company is divided into parts through the use of these five metrics. With the help of this frame work, customer behaviour, conversion statistics, web analyses, and more are measured. The concept of the AARRR framework is based on the five areas explained below.
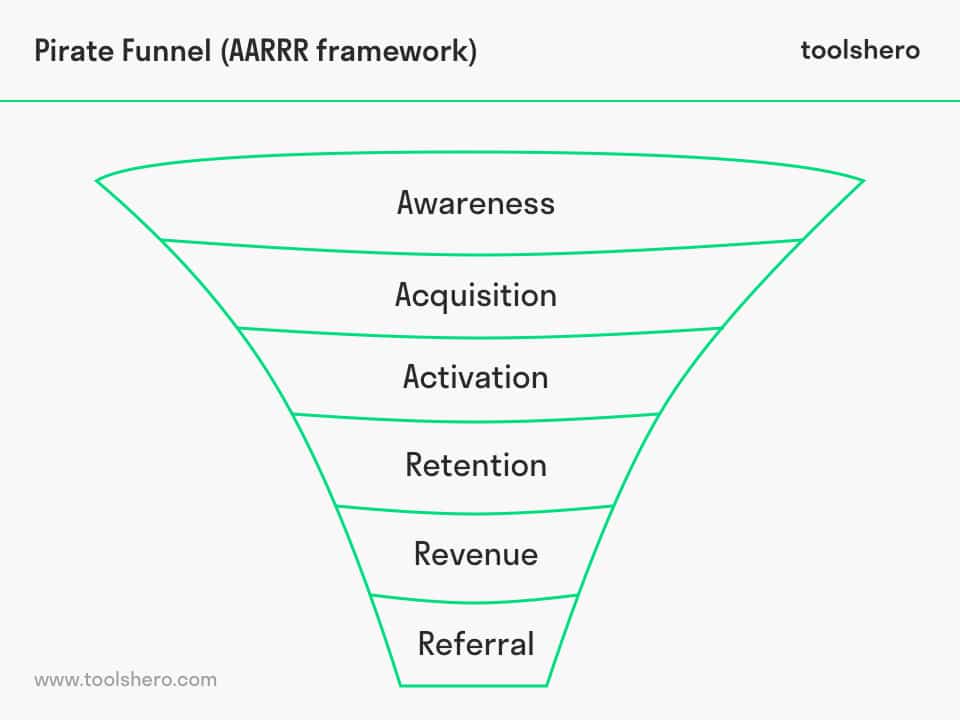
Figure 1 – Pirate Funnel (AARRR Framework)
Acquisition
Acquisition describes how people find a product / service or brand and eventually become customers. For this segment of the statistics, it is important to precisely observe website visitors and website data. How many visitors does the website get on a daily basis? How many of those visitors actually buy something?
It is important to follow the customer journey through the funnel, and not to only look at the conversion rate. Every micro conversion done along the way is valuable as well. Micro conversion denotes the small steps in the process.
For a random customer at a random company, this can be the following: website visit -> email contact -> participation in a webinar -> telephone contact with the sales team -> conversion to customer complete. All the steps in this process are micro conversions and are very important in order to understand how the consumer eventually turns into a customer.
It is vital to distinguish between a lead and a qualified lead in this part of the purchasing process. A lead is a visitor of a website whose contact details, or other information, have been recorded. This can be an email address, a phone number, address information, etc.
The fact that someone has signed up with their email, however, does not say much about whether or not they want to make a purchase. Some people only sign up because of a special offer for a free book, for instance, and nothing else. Others are curious and want to stay up to date because they are interested in the brand or the company.
However, if a lead has completed the following micro conversions, like watching a webinar for example, the lead can be seen as a qualified lead because they are actively involved in learning more about the company. That is the moment when the sales team should engage.
Acquisition statistics
- New Leads
- Cost of Customer Acquisition (CAC)
Acquisition methods / tools
- Search Engine Optimisation (SEO) makes it possible to get an insight into the visibility of a website via Google or other search engines.
- Search Engine Marketing (SEM) is used in the AARRR Framework to link certain ads to users’ searches via Google.
- Social networks are used as distribution channels. Both organic and paid online campaigns are necessary to increase a brand’s visibility.
- Blogging is used to simulate a longer conversation with a wider audience. People get to know the brand in a different way
- Apps
- TV
- Etc.
Activation
The theory behind the activation and acquisition statistics occasionally overlaps. The reason for this will become clear later on in the article. Activation is about the first experience a customer has with a product.
It is the customer’s aha-moment. The moment when he or she realises that there is real value in a product, and for that specific reason returns. The time between the moment a user has their first experience with a brand and their aha-moment, is the activation statistic in a nutshell.
The reason that customer conversion is listed under acquisition is because someone who signs up for a service is sometimes converted to a customer, even though the potential is not necessarily used. This differs depending on the type of company. For an e-commerce company, activation is less important after conversion, but more so just after a micro conversion.
One must examine how much content visitors take in, and how they take it in. How much time does a consumer spend looking at these clothes?
An activated customer is a customer who returns time and time again to use a product. Facebook achieved this early on in their expansive growth. The aha-moment for Facebook users occurred when they suddenly had 10 new friends on day 1.
Twitter and other major social media channels took note that a user will return quicker if he has friends or connections on the medium. This is why new users are immediately introduced to popular accounts. If they start following these, there is a greater chance they will come back to read updates or to make new friends.
To bring as many users as possible to the aha-moment, a company must be sure that the boarding process is as quick as possible. Additionally, testing must be conducted just like Twitter, Facebook, and Instagram do on a large scale. Various A/B testing methods, and other experiments, all try to predict the consumer’s behaviour in order to effectively persuade the user to take action.
Activation statistics for the AARRR Framework
- New sign-ups
- First time opening the application
- First time opening emails
Activation methods / tools
- Homepage that is effective in converting customers
- Effective landing pages that provide customers with a controlled experience
- Product features and properties that offer value to existing customers, but can also attract new customers.
- Tutorials
Retention
Retention is about the question: how many customers are kept, and why are others lost? Customer retention says a lot about a company’s marketing efforts. Customer retention means that existing customers regularly return to use a product.
For an e-commerce company, this means that someone makes a purchase more than once. For an app this means that users log in more often. The opposite of customer retention is customer churn. It is important to keep track of statistics for both customer retention, and customer churn.
The ratio of customer retention / customer churn, in a way, shows whether a company has achieved a good combination of products, and if they have reached their target market. If many customers return the product after using it for the first time, something is seriously wrong.
However, these customers are also a great source of learning and understanding. The customer churn percentage needs to be much lower than the customer retention percentage. For many companies, this is the only way to grow.
According to the Harvard Business Review, it is five to twenty-five times more expensive to gain a new customer than it is to keep an existing one. It is also much easier to sell something to someone who has already made a purchase from a company. This is because a certain bond of trust has been created from the consumer to the company during previous purchasing processes.
This is precisely why it is much cheaper to sell a product to an already existing customer, than it is to sell a product to a new one. To retain customers, it is important to stay in regular contact with them through special offers, newsletters, personal messages, etc.
Retention statistics / metrics for the AARRR Framework
- Number of sessions per user
- Daily active users (DAU)
- Monthly active users (MAU)
Retention methods/tools
- Emails such as promotions and invitations to events, etc.
- Blogs and vlogs
- Telephone contact
- Gamification
- Push notifications
Referral
Referral within the AARRR Framework is about the question: how do we ensure that our customers will recommend us to others? This is the best way to stimulate growth. If all customers recommend the product or service of a company to others, the company no longer needs to do anything in this area.
To stimulate referrals, the company has to have a systematic process in place that consistently stimulates and generates customer growth and referrals. Dropbox used incentives for recommendations, and found out that this was one of the most important driving forces behind their growth.
A metric for measuring this is the Net Promoter Score (NPS).
Referral statistics
- Net Promoter Score
- Referrals
- Shared messages on social media
- Mentions in messages
Referral methods/tools
- Campaigns
- Emails
- Referral marketing
- Giveaways
AARRR Framework and turnover
Turnover is about the question: how can we raise revenue? If all other sections of the AARRR framework have been satisfied, the organisation should generate a sufficient amount of turnover. Income and coming up with new ideas for generating turnover are important for all organisations, and especially for start-ups.
Companies such as Facebook and Instagram only started facilitating advertisers at a later stage, whilst presently, this is the main driving force behind their success. It is generally accepted that the best way to generate income is by raising the Customer Lifetime Value (CLV) and lowering the Customer Acquisition Cost (CAC).
The value of a customer is equal to all income generated from that customer over the course of his or her life. CAC is the amount that was spent on attracting the customer. This encompasses all sorts of costs, marketing, sales, staff fees, meetings, etc. A good ratio between CLV and CAC is three to one. To lower acquisition costs, the best thing to do is optimise the sales funnel. The AARRR framework is especially effective when it comes to this.
This tool helps to identify the simplest and most effective ways of enabling growth and development in an inexpensive way.
Turnover statistics / metrics
- Average turnover per user
- Average turnover per paid user
- Customer Lifetime Value (CLV)
Turnover increase methods/tools
- Advertisements
- The continuous generating of qualified leads is important to keep a company going
- Business Development efforts can help the company create as much company value as possible. This is true for all sorts of businesses
AARRR Framework: Why are metrics and statistics so important in the business world?
Metrics and Statistics are of great value to any manager, as they serve as a tool for making important decisions. For example, uncertainty always plays a major role in setting expectations, and sufficient data and statistics can take a part of that uncertainty away.
Statistics are used for prognoses, analyses, profit projections, taking samples, quality management, and more. The use of statistics provides information about complex situations, instead of making decisions based on unfounded reasoning.
Performance measurements
Statistics are often used to measure performance. For instance, information is collected about a production unit in order to be able to make an estimate of the quality level of a batch. This method is also known as statistical sampling.
Another way to use statistics in performance measurements is to analyse an employee’s productivity. In many organisations this has to comply with certain standards. If this is not the case, statistics will reveal this.
Predictions
Managers analyse information from the past to predict future trends. For instance, data on sales history is analysed to make estimates of future sales numbers. Some deviations can be taken into account during this process, such as market conditions, or other economic factors. Projections based on statistics can then be used to create production schedules.
Risk/revenue
The goal of a project is to optimise revenue and minimise risk. Through data and statistics, managers can review projects from different angles.

Now it is your turn
What do you think? Are you familiar with the explanation of the AARRR funnel framework? Are these kinds of statistics kept in your work environment? Would using this framework be effective in your work environment? According to you, which other statistics are important to keep track of? Do you have any tips or comments?
Share your experience and knowledge in the comments box below.
More information
- Nguyen, T. (2020). Optimizing the Growth Hacking Funnel for startups: A case study of We Encourage Oy.
- Le, T. (2019). Growth Hacking and AAARR Funnel Implementation for a SaaS company.
- Lennarz, H. (2017). Valid Data for valid Decisions. In Growth Hacking mit Strategie (pp. 107-122). Springer Gabler, Wiesbaden.
- Ratcliffe, J. (2017). Developing metrics for your sales funnel: how to implement the AARRR acronym. Journal of Aesthetic Nursing, 6(6), 318-319.
How to cite this article:
Janse, B. (2020). AARRR Framework. Retrieved [insert date] from Toolshero: https://www.toolshero.com/marketing/pirate-funnel-aarrr-framework/
Published on: 10/29/2020 | Last update: 08/15/2023
Add a link to this page on your website:
<a href=”https://www.toolshero.com/marketing/pirate-funnel-aarrr-framework/”>Toolshero: AARRR Framework</a>
Ben Janse
Ben Janse is a young professional working at ToolsHero as Content Manager. He is also an International Business student at Rotterdam Business School where he focusses on analyzing and developing management models. Thanks to his theoretical and practical knowledge, he knows how to distinguish main- and side issues and to make the essence of each article clearly visible.

Related ARTICLES

Social Commerce: definition and examples

Storytelling Method: Basics and Steps

Content Marketing explained including strategy

Influencer Marketing: Basics and Strategy explained

Content Analysis explained plus example