Regression Analysis explained

Regression Analysis: this article provides a practical explanation of Regression Analysis. After reading, you’ll understand the basics of this powerful marketing tool.
What is Regression Analysis?
Regression Analysis is a statistical method used to discover links between different variables in, for example, a data set. It is an important tool for modelling and analysing data. The tool is also used for forecasting and identifying cause-effect relationships.
It is used in investigating the causes of fatal road accidents, for example. This statistical method exposes the relationship between dependent and independent variables. Moreover, it also demonstrates the strength of the impact of one variable on another.

Generally speaking, it is difficult to examine a large series of numbers in a data set and understand exactly which relationships or associations there are between these data points. In this situation, the use of a Regression Analysis is the best method to make a prediction based on the set of data. There are different types of software available that can be used to perform a Regression Analysis.
The term regression is derived from the phenomenon that the height of descendants of tall ancestors tends to become shorter and adapt towards the average.
This theory was devised by Francis Galton, although purely in the context described above. His work would later be expanded for a more general context. Regression Analysis remains an important area of active research. In recent years, many new methods have been developed to identify different types of complex regression.
Terminology in Regression Analysis
In order to break down the results of a Regression Analysis, it is important to understand the basic jargon first. The most common terminology used when conducting a Regression Analysis are described below.
Relationships
When talking about this statistical method, people often speak of correlations. However, a correlation analysis is in fact only used to represent the relationship or association between two continuous variables. Regression Analysis is a similar technique, but it measures the relationship between an outcome variable and one or more disruptive variables.
Variables
The outcome variable is often also referred to as the response or dependent variable. The disruptive risk factors are called the predictive or independent variables. In the Regression Analysis, the dependent variables are represented by a Y, and the independent variables by an X.
Outliers
Outliers are a problem in statistics because they affect most parametric statistics. For example, averages, standard deviations, and correlations are extremely sensitive to this. In some cases, the outliers can make an entire analysis worthless.
Despite these problems, one cannot simply exclude the outliers. They may in fact be legitimate data that can sometimes have interesting causes. It is therefore important to find the cause of the outliers.
Multicollinearity
One speaks of multicollinearity when, in a analysis, the independent variables appear to have correlations. This may be a problem, because, as the name suggests, independent variables are supposed to be independent.
The idea is that when the value of a certain independent variable is changed, another independent variable remains the same. If a change in one causes a change in the other, it becomes difficult for the model to estimate the relationship between the independent and dependent variables. This is because both variables tend to be changed simultaneously.
Heteroscedasticity / homoscedasticity
One speaks of homoscedasticity when the error term, noise, or other disturbance is the same for all values of the independent variable. Heteroscedasticity is present when the magnitude of this error term differs between certain values of an independent variable.
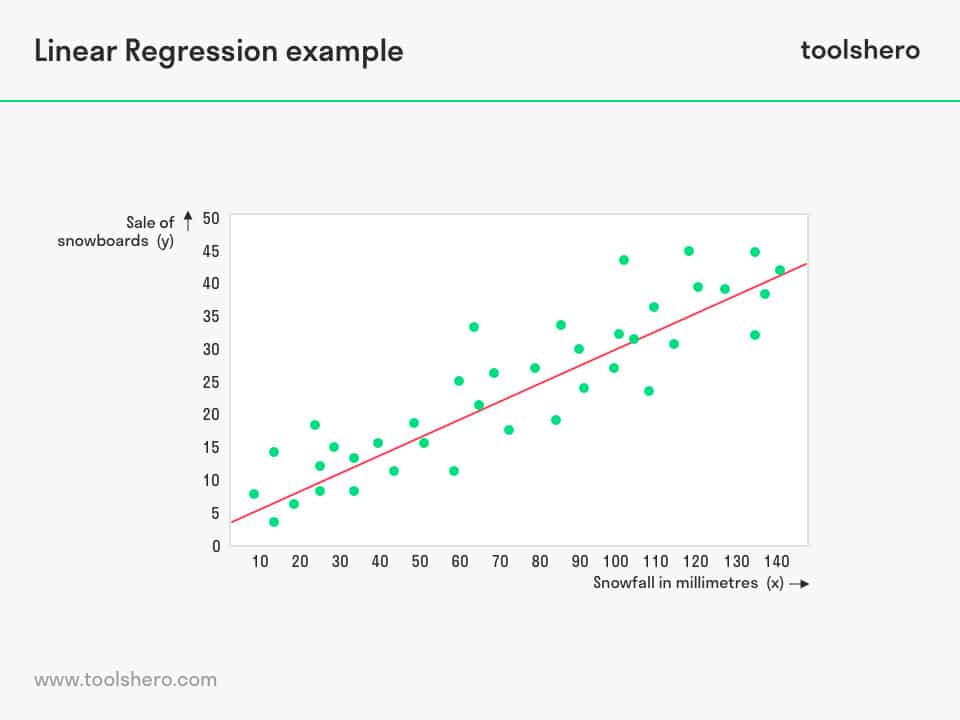
Linear Regression
Linear regression is a form of Regression Analysis in which the relationship between dependent variables (Y) and one or more independent variables (X) is analysed. This is visualised by a line, also known as the regression line.
As its name suggests, the nature of this line is linear. In this form, the dependent variable is continuous, and the independent variable may either be continuous or interrupting.
This is the simplest form of this statistical method. For example, it allows for an easy way to indicate the relationship between the mileage of a car and maintenance costs.
Non-linear Regression
What characterises a linear regression analysis is the fact that the line is linear. A non-linear comparison can therefore take many different forms. For this reason, this form of Regression Analysis also offers the best functionalities for curve fitting. Non-linear regression includes several types, including the ones below.
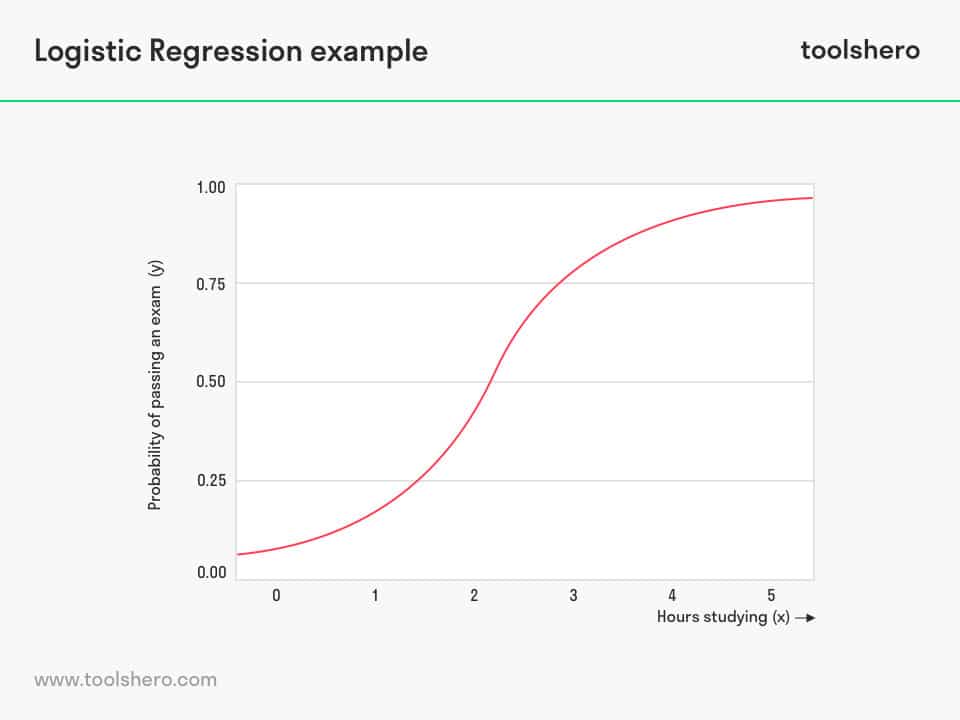
Logistics Regression
Logistics regression is the form of Regression Analysis that is used to link the dichotomous dependent outcome variable to one or more other variables. It is a predictive analysis tool and is used to describe the relationship between one variable and another.
This type of Regression Analysis is closest to linear analysis and can be considered an alternative to linear analysis if the measured variables are not continuous.
Ridge Regression
We’ve already seen how data sets can face multiple problems, such as multicollinearity. In case of multicollinearity, the regression data can still be analysed through special analysis methods, such as Ridge Regression.
In ridge regression, the formula reduces the standard errors in the variables, so that the results are hopefully more reliable.
Lasso Regression
Lasso Regression is a type of Regression Analysis that uses shrinking. Shrinking occurs when regression coefficients are shrunk and brought to a central point, such as the average or zero. This type of regression analysis is suitable for data sets with a high level of multicollinearity.
The acronym LASSO stands for Least Absolute Shrimping and Selection Operator.
Regression Analysis In Practice
A analysis may be performed by anyone who needs help in finding relationships between data. At the same time, the analysis has also proved to be an effective tool for business decisions.
For instance, Regression Analysis can be beneficial when analysing data and display relationships that can help a manager predict short-term or long-term sales, or what the inventory levels will look like in the future. This analysis tool can also be used to better understand the demand and supply for a product or service from a particular sector. The more data, the more different variables may influence these elements.
For forecasts, the Regression Analysis is used to show the relationship between two different variables, the dependent and independent variables. For example, a relationship can be established between the GDP (gross domestic product) and the turnover of a business. Subsequently, the following question may be answered: if the GDP increases by 3%, how much can my turnover increase?

Now it’s your turn
What do you think? Are you familiar with the explanation of Regression Analysis? Have you ever implemented this type of data analysis, or do you think it can be applied in your work environment in the future? Do you have any tips or additional comments?
Share your experience and knowledge in the comments box below.
More information
- Draper, N. R., & Smith, H. (2014). Applied regression analysis (Vol. 326). John Wiley & Sons.
- Montgomery, D. C., Peck, E. A., & Vining, G. G. (2012). Introduction to linear regression analysis (Vol. 821). John Wiley & Sons.
- Watson, G. S. (1964). Smooth regression analysis. Sankhyā: The Indian Journal of Statistics, Series A, 359-372.
How to cite this article:
Janse, B. (2019). Regression Analysis. Retrieved [insert date] from Toolshero: https://www.toolshero.com/marketing/regression-analysis/
Original publication date: 05/13/2019 | Last update: 05/18/2023
Add a link to this page on your website:
<a href=”https://www.toolshero.com/marketing/regression-analysis/”>Toolshero: Regression Analysis</a>
Ben Janse
Ben Janse is a young professional working at ToolsHero as Content Manager. He is also an International Business student at Rotterdam Business School where he focusses on analyzing and developing management models. Thanks to his theoretical and practical knowledge, he knows how to distinguish main- and side issues and to make the essence of each article clearly visible.

Related ARTICLES


Product Life Cycle Stages Theory with Examples

Business Experiments: Steps and Examples

Five Product Levels by Philip Kotler

Buy Sell Hierarchy (Miller and Heiman)