Interrelationship Diagram

Interrelationship diagram: this article explains the concept of an interrelationship diagram in a practical way. After reading, you’ll understand the basics of this powerful problem solving method.
What is an interrelationship diagram?
An interrelationship diagram is a graphical tool that is used to demonstrate various relationships between factors, processes, areas, or other aspects. An interrelationship diagram, or ID, helps the user visualise exactly how a number of problems and causes are related within the organisation or other environment. When used correctly, these diagrams are effective and useful, and they can help make intelligent and strategic decisions.
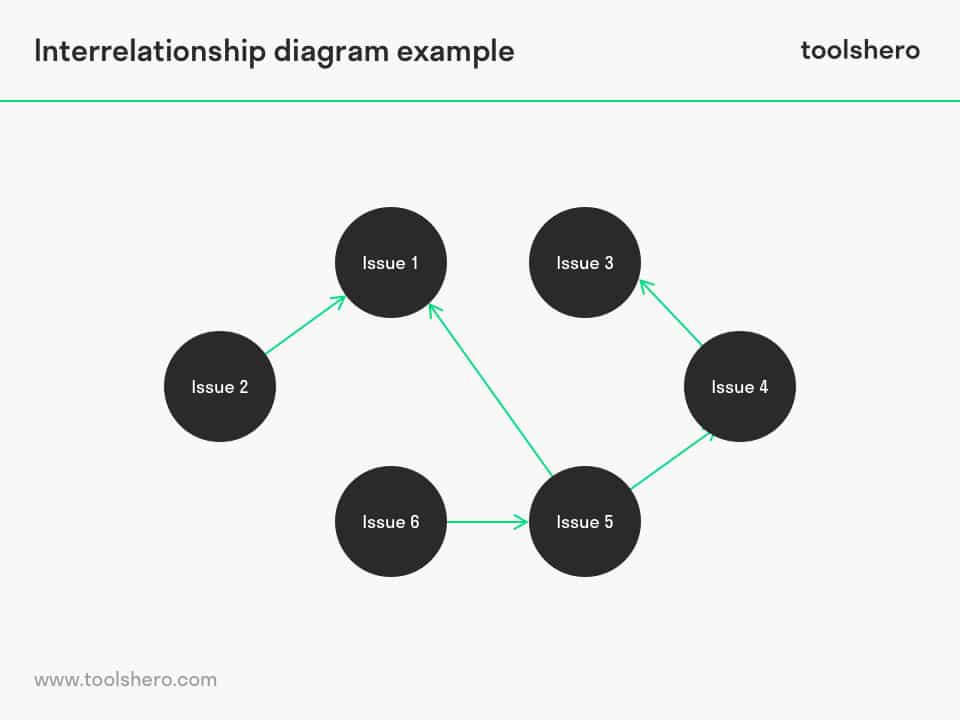
An interrelationship diagram consist of a series of boxes or circles, each of which represents an issue to be considered. The boxes are organised in a radial pattern, and lines connecting the boxes indicate the relationships between the various issues.

Arrows show the direction of direct relationships and distinguish causes from symptoms. To prevent coming up with solutions to problems that are not based on symptoms, the Ishikawa diagram may be used.
A interrelationship diagram can be valuable in many situations in which one is looking for causes of specific problems. Another tool for doing this is the root cause analysis. It’s quite easy to learn how these diagrams can be used. This article also contains a step-by-step plan to get you started straight away.
When to use an interrelationship diagram?
One can imagine various situations in which it’s important to find the cause for a certain problem. Not all situations allow for the use of interrelationship diagrams to do so, though.
An interrelationship diagram can be used for the following purposes:
- Identifying connections between ideas
- Understanding cause-and-effect relationships
- Analysing complex problems
- Developing fishbone/tree diagrams
- Understanding how various aspects of a problem are related
Step-by-step Interrelationship Diagram Plan
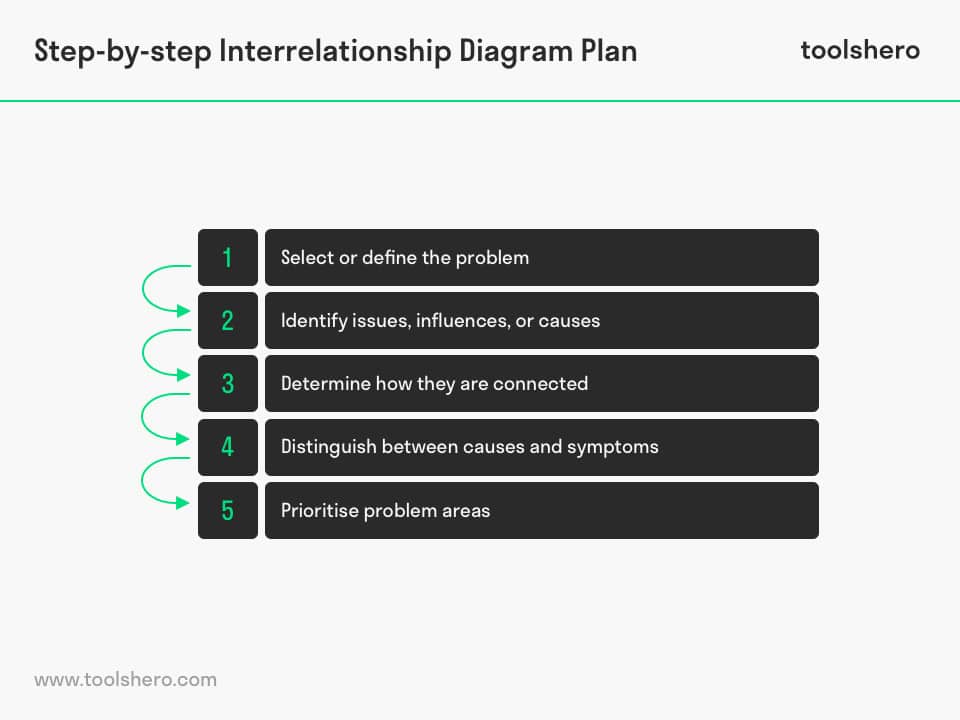
1. Select or define the problem
To get started with making an ID, one has to select a problem first. Interrelationship diagrams are often made for a specific problem, but problems or inefficiencies may also be looked for within the organisation.
Virtually all organisations have a long list of problems or issues that need to be resolved. Organisations that are most successful in coming up with solutions and hire capable staff set themselves apart from organisations that don’t do as well.
Once the problem has been selected, it should be written on top of the page used for the diagram, as its subject. From there, move to step two to identify various other problems that influence this problem.
- Select a problem
- Write on drawing paper for diagram
2. Identify issues, influences, or causes
At the second step of making interrelationship diagrams, it’s time for brainstorming. Think of all the problems within the organisation that may be connected to the problem on the table, and write all of them around the subject written on the paper.
At this point, a specific shape is not yet important. Depending on the problem, and the number of influences relating to the problem and the company, it may be the case that only a few potential problems are written down on the page, or that the entire page is filled and some more pages later.
- Identify all connections to the problem
- Write them down spread across the sheet for the diagram
3. Determine how they are connected
At the third step for an interrelationship diagram, it is determined how the various connections influence the problem. At this point, the page used for the diagram may look like a mess. That will be solved at the next step.
At this moment, it’s important that it becomes known how all elements on the page influence one another. The most important goal of this diagram exercise is to determine and understand how various elements work together within an organisation.
- Determine connections between elements on the sheet of paper for the diagram
4. Distinguish between causes and symptoms
The fourth step in this process is also the core of the process. Here, it’s about determining what are causes and what are consequences.
The entire process should be studied carefully in order to determine which elements on the page are causes of the problem, and which ones are symptoms or consequences.
In many cases, there will be points that fall into both categories, depending on when the event or action took place. Arrows are used to represent the relationships between elements.
At this step, the whole starts to look very much like a diagram. A certain direction starts to develop within the diagram, and the cause of the problem soon becomes clear.
- Determine cause and effect
- Draw lines between elements
- Use arrows to indicate the direction of the relationship
5. Prioritise problem areas
It may still be difficult to discover relationships in the diagram. One should mainly look at the elements in the diagram that have a lot of arrows pointing away from them. These may form the core of the problem.
It’s common to have one or several points that could lead to a variety of problems within an organisation. This means that when these points are identified, major steps forward could be made. Take your time to look at the diagram, redraw it, or investigate one of the elements in more detail if it’s worth the effort.
- Identify issues or areas of concern
- Study them
6. Decide on a solution
The end goal is to solve the problem at the top of the page; the reason why an interrelationship diagram is made. Make sure the diagram is correct and that nothing has been forgotten that influences the problem.
Then, carefully determine the cause of the problem. Use critical thinking ability and combine it with the insights gained while choosing the solution.
- Select an effective solution
Interrelationship diagram in Summary
An interrelationship diagram (ID) offers a simple way of visualising how various problems are connected to one another, and may help determine whether or not problems are causing other problems.
The diagram usually consists of a set of circles, each of which represents an element that influences the problem. Connecting lines are used to represent the relationship between elements.
The analysis required for making an interrelationship diagram involves six steps. Even though the tool does not provide detailed reasons for the problem, diagrams do demonstrate the relationships between causes and consequences in a clear way.

Now it’s your turn
What do you think? Do you recognise the explanation about the interrelationship diagram? Would you benefit from using such a diagram? What do you think are the pros and cons of using interrelationship diagrams? Do you have any tips or additional comments?
Share your experience and knowledge in the comments box below.
More information
- Alänge, S. (2009). The Affinity-Interrelationship Method AIM.
- Ilie, G., & Ciocoiu, C. N. (2010). Application of fishbone diagram to determine the risk of an event with multiple causes. Management Research and Practice, 2(1), 1-20.
- Pearl, J., & Mackenzie, D. (2018). The book of why: the new science of cause and effect. Basic Books.
How to cite this article:
Janse, B. (2019). Interrelationship Diagram. Retrieved [insert date] from toolshero: https://www.toolshero.com/problem-solving/interrelationship-diagram/
Add a link to this page on your website:
<a href=”https://www.toolshero.com/problem-solving/interrelationship-diagram/”>toolshero: Interrelationship Diagram</a>
Published on: 25/09/2019 | Last update: 04/03/2022
Ben Janse
Ben Janse is a young professional working at ToolsHero as Content Manager. He is also an International Business student at Rotterdam Business School where he focusses on analyzing and developing management models. Thanks to his theoretical and practical knowledge, he knows how to distinguish main- and side issues and to make the essence of each article clearly visible.