
Pareto Analysis explained plus example

Pareto Analysis: this article explains the theory of Pareto Analysis by Vilfredo Pareto in a practical way. After reading you will understand the basics of this problem solving tool. This article explains what the analysis is and which steps are needed to apply the analysis, along with an example.
What is the Pareto Analysis?
The Pareto Analysis, also known as the Pareto principle or 80/20 rule, assumes that the large majority of problems (80%) is determined by a few important causes (20%). This makes the tool very effective for determining where you should focus efforts to achieve improvements.
The founder of this analysis, Italian economist Vilfredo Pareto, discovered this when he was carrying out a study at the end of the 18th century in which he ascertained that 20% of the population owned 80% of the property.

This method was further developed by total quality management guru Joseph Juran (after 1940) and can be applied to various matters (for instance decision-making and other complex issues).
A few of the 80/20 rule examples from daily practice which are often correct are:
- 80% of the customer complaints ensue from 20% of the products or services delivered.
- 20% of the products or services yield 80% of the profits.
- 20% of the people responsible for sales generate 80% of the operational income.
- 80% of the system failures are caused by 20% of the system problems.
The principle of this method is based on the Zipf distribution (pattern in linguistics and a discrete probability distribution with parameters λ and N).
In addition to being a static technique, the Pareto Analysis is a creative and practical way of looking at the causes of problems. It stimulates ideas about thinking and organizing. This method helps identify the main causes (20%) that lead to 80% of the problems that need are to be solved.
As soon as the main causes have been identified, the diagnostic techniques such as the Ishikawa diagram or fishbone analysis can be used to identify and address the deeper causes of the problems.
Practice of the Pareto Analysis
In order to apply the analysis in practice some basic steps have been defined which can be followed to arrive at a thorough analysis.
Step 1: Measuring – identify the problems and document them in a table
Based on observations, interviews and reports, data can be collected from which problems can be deduced. Subsequently, these problems are documented in a table and grouped if possible.
It is important to apply the ‘cause-effect’ theory to each item so that the source of each documented problem can be found. There are several techniques that can help in this such as for example the Root Cause Analysis (RCA).
Step 2: Determine their order of importance
Organize the inventoried problems in ranking order from the most important down to the least important in descending order. Make sure that the most important cause is documented first.
Step 3: Mark or score each recorded problem
Now that the problems have been identified, deduced and been put in order of importance, it is essential to link these to a mark or score. The way in which a score must be calculated depends on the type of problem that needs to be solved.
For example a financial approach (improvement of profits) will focus on how the score relates to what costs are involved with solving these problems. Is the focus on customer-orientation (improving customer satisfaction), then the focus is on the number of complaints that need to be solved.
Pareto Analysis example
An example is a computation of the cumulative percentages of problem costs, in other words, the number of times a department is faced with this problem or the opportunities of how a department can increase sales.
Step 4: Group the identified problem and add the marks or scores
The identified problems are grouped based on their causes. If, for example, there are five problems that lead to dysfunctional employees then put them together in one group. Now that all problems have been grouped, the marks or scores are added.
The group with the highest score must be given the highest priority in order so that they can be dealt with. This is where the most results can be obtained in terms of optimization.
The data can be converted into a graph called a PA Diagram, also called Pareto charts. It is an effective quality control and management tool. The Chart indicates the frequency of defects, as well as the cumulative impact they have.
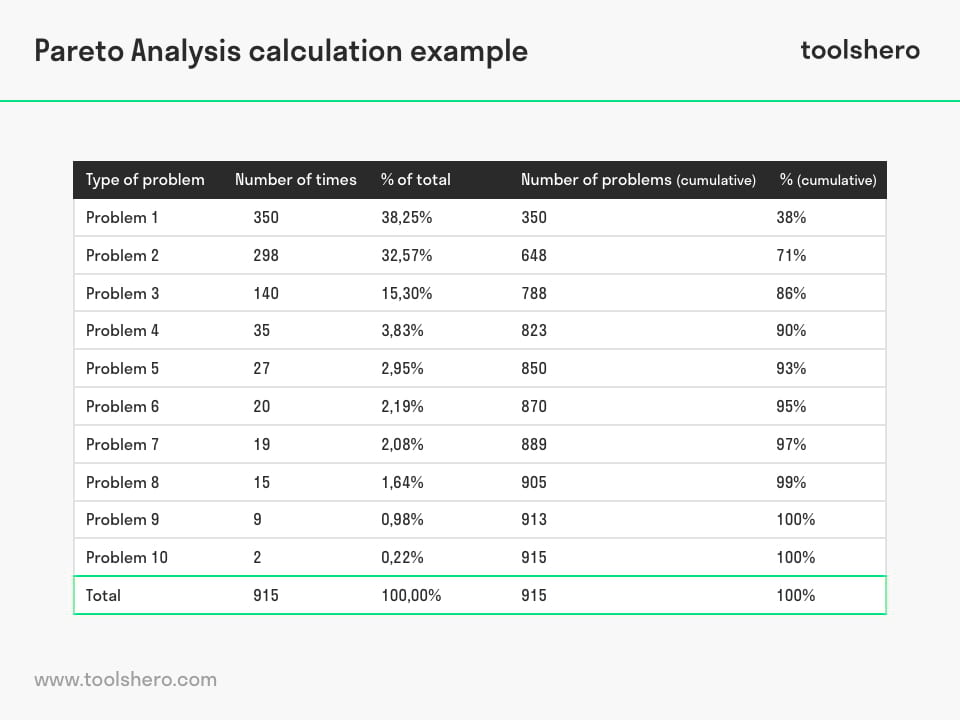
Figure 1 – Pareto Analysis Example
Pareto Analysis diagram
The vertical axis of the diagram represent the number of counts for each category. The horizontal axis of the chart represent the names of the variables.
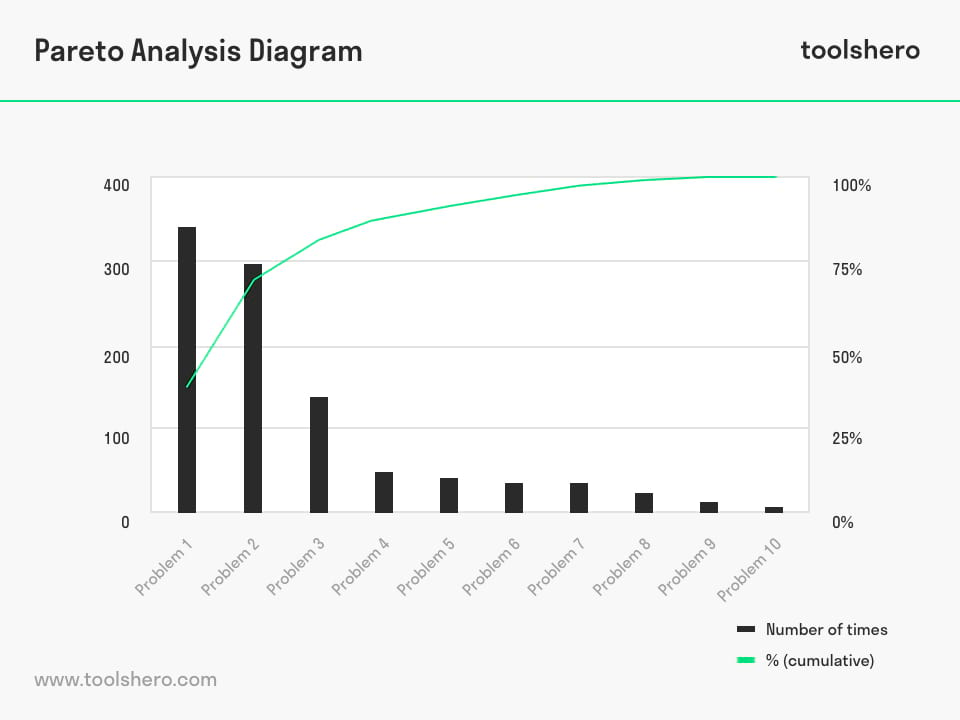
Figure 2 – Plotted Pareto Analysis Diagram
Step 5: Time to act, based on the Pareto Analysis
Using the information from step 4, an action plan can be drawn up in which performance improvement actions can be formulated.
Making a separate business case for each prioritized or grouped problem including a Return on Investment (ROI) is recommended in order to get commitment from senior management.

It’s Your Turn
What do you think? Are you familiar with the Pareto Analysis or PA Diagram? Do you recognize the practical explanation or do you have more suggestions? What are your success factors for the good problem analysis and approach?
Share your experience and knowledge in the comments box below.
More information
- Fotopoulos, C., Kafetzopoulos, D., & Gotzamani, K. (2011). Critical factors for effective implementation of the HACCP system: a Pareto analysis. British Food Journal, 113(5), 578-597.
- Karuppusami, G., & Gandhinathan, R. (2006). Pareto analysis of critical success factors of total quality management: A literature review and analysis. The TQM magazine, 18(4), 372-385.
- Kaliszewski, I. (1994). Quantitative Pareto analysis by cone separation technique. Kluwer Academic Publishers.
How to cite this article:
Mulder, P. (2012). Pareto Analysis. Retrieved [insert date] from Toolshero: https://www.toolshero.com/problem-solving/pareto-analysis/
Original publication date: 08/12/2013 | Last update: 07/31/2023
Add a link to this page on your website:
<a href=”https://www.toolshero.com/problem-solving/pareto-analysis/”>Toolshero:Pareto Analysis</a>
Related ARTICLES

Convergent Thinking: the Definition and Theory

Artificial Intelligence (AI) explained

CATWOE Analysis: theory and example

Means End Analysis: the basics and example

Systems Thinking: Theory and Definition


One response to “Pareto Analysis explained plus example”
Btw, I think it is: “80% of the system problems/defects are caused by 20% of the system failures “