Swim Lane Diagram explained

Swim Lane Diagram: this article provides a practical explanation of the Swim Lane Diagram. Next to what it is (definition, meaning and origin), this article also highlights the structure and elements of a Swim Lane Diagram including an example, how to use this method, the steps to create one, the advantages of using this method and a downloadable Swim Lane Diagram template to get started immediately. Enjoy reading!
What is a Swim Lane Diagram?
Definition
A swim lane diagram is a type of flow chart or cross-functional diagram, in which the process is subdivided into categories. The difference between a normal flow chart and the swim lane diagram, is that the latter shows exactly who needs to do what in a process.
A swim lane or flow represents the activities that have to be carried out by a specific department or entity. The name of the diagram comes from the similarity between the horizontal lines of the diagram and swim lanes in a swimming pool. Swim lane diagrams are part of Business Process Mapping (BPM).

Meaning
The different lanes are meant to represent the connections, communication, and transfer between, for instance, different departments or colleagues. By visualising the process in this way, it becomes clear where it’s still lacking in efficiency and who is responsible for a certain task.
This type of flow was introduced around 1940. It was a type of flow chart with multiple columns. These were used to represent processes that were being worked on by multiple departments.
Origin
In 1990, Geary Rummler and Alan Brache wrote their book ‘Improving Process’.
They first described the swim lane diagram, or swimlane flowchart. That’s why these swim lane diagrams are sometimes called Rummler-Brache diagrams. Doctor and engineer Binner is also credited with developing the diagram. In the 1980s, it was part of his thesis on the requirements of information technologies.
The concept was introduced into the computer modelling world in 1993. Later, Microsoft Visio also introduced the swim lane diagram in its software.
Rules
The swim lane diagram differs from other flow charts because activities are grouped in different lanes. Parallel lines divide the diagram into different lanes. Each lane can be labelled as the user sees fit, but usually represents a single person or department.
Example of a Swim Lane Diagram
The image shows how the activities combine to make up the whole process, from start to finish, starting at the top. Standard flow chart symbols, such as arrows between the different elements, show the flow of information or materials to other sub-parts. The diagram uses standard flow chart symbols.
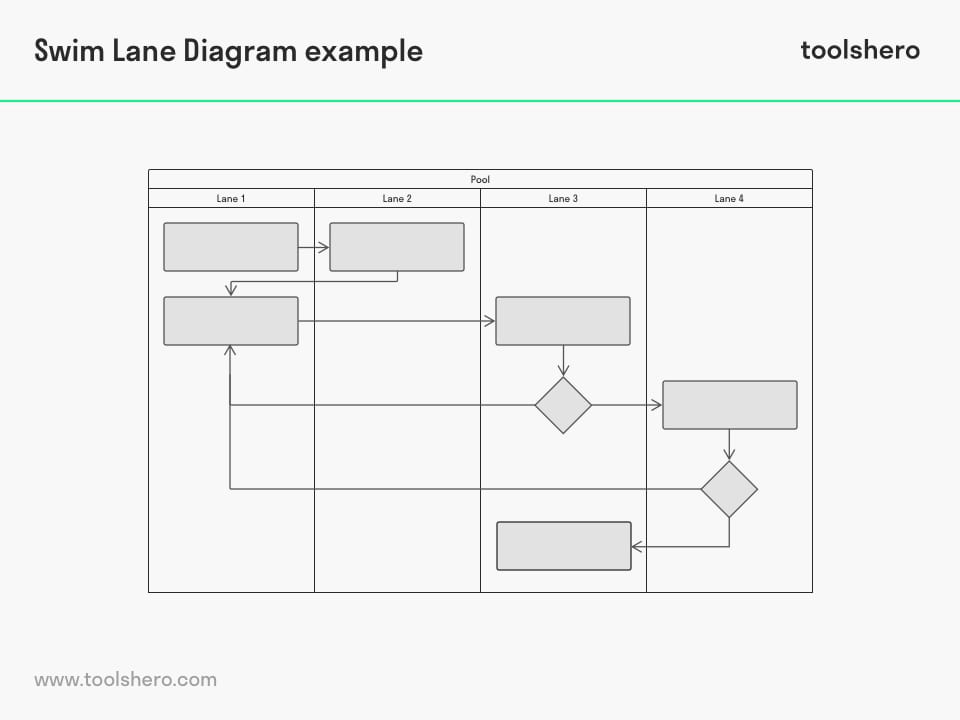
Figure 1 – an example of a Swim Lane Diagram
This type of flow can also be flipped to show that the categories are shown on the left. That can be easier when using it, as many diagrams are wider than they are tall. It also offers a better view of the flow of information or goods.
Using the Swim Lane Diagram
It is used in many organisations where multiple departments work on the same process. The simplicity of the tool makes it useful to support many interdisciplinary tasks.
The tool mainly helps employees know about each other’s responsibilities. That prevents overlap and encourages people working together.
It also offers a clear overview of different processes to gain insight into process delays or capacity limitations. These can then be resolved, which will increase the performance and quality of the process, while reducing costs.
This type of flow is used for, for instance:
- Product development
- Marketing and sales
- Supply chain management (logistic)
- Similar processes
Swim Lane Diagram, a step-by-step plan
Making a diagram isn’t difficult and can be done using either a computer or pen and paper. Invite everyone involved with the business process to be present when making it.
One of the goals of drawing a diagram is to gain insight into efficiency. Therefore, consider the desired outcome and the expected results first.
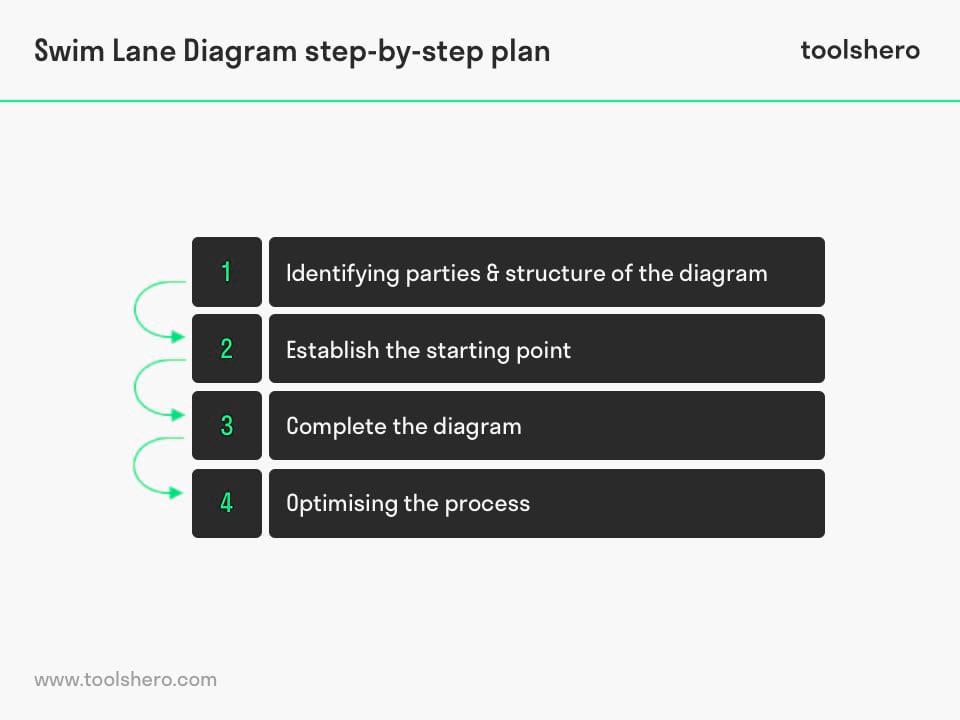
Figure 2 – Steps to build a Swim Lane Diagram
Step 1: identifying parties & structure of the diagram
The first step is writing down all the participants in the process. Based on the number of parties involved, you draw a number of horizontal or vertical lines; remember, it can be used either horizontally or vertically.
The entities that are involved with the process have to be labelled. These can be departments, teams, subgroups, individuals, key players, businesses, or branches.
Do try to make sure that this type of flow doesn’t include too many entities. Generally, the number is between four and twelve. More would make the diagram chaotic, while less would make it unnecessary.
Step 2: establish the starting point
This step is about determining the starting point of the diagram. Visualise the start of the process by using the right standard symbols.
The starting point is shown in one of the lanes you drew. Sometimes the starting point of the process is an entity decision from upper management. In the case of a sales process, it’s the customer’s order.
Step 3: complete the diagram
Now add more steps to the flow chart. Each step is connected to the one before using a line and arrow. If there are multiple actions or steps in a specific lane, add them from the top down. Go from left to right and vice versa if the next step is a response to an activity from another entity.
Write what the action entails in the symbol of each step. The arrows between the steps show the flow of information or materials. Do this until all steps are shown in the flow chart.
Drawing the diagram sounds easy enough, but determining the right order can be complicated. Usually it’s chronological, but the outcomes of actions of different entities can have different effects. It can for instance lead to a loop in the actions, which makes the whole thing less clear.
Step 4: optimising the process
When the process is fully shown in the diagram, it can be optimised. This is one of the most important steps when making a swim lane diagram. By properly studying the business process, you have to choose actions in the diagram that are crucial to completing the process.
Having too many tasks can mean that the different entities are wasting time and resources. This can be more efficient. Use Business Process Re-engineering (BPR) for this.
Having too few actions in the flow chart can also lead to inefficiency in the form of no or undesired results.
Advantages of the Swim Lane Diagram
The use of this method has a number of advantages when applied to business process. We explain a few below:
1. Simplifying complex business processes
Many processes are complicated and confusing because of the high density of different activities and ambiguity regarding order. Swim lane diagrams bring structure to these processes and show information about the process to the user in a visual manner.
When used correctly, mapping the business process can provide insights into the parties involved, their goals, their abilities, and the way in which they communicate and transfer information.
2. Improving communication through the Swim Lane Diagram
The business process visualised by the swimlane diagram is an accurate representation of the entire internal work environment. This makes all the connections between different departments clear.
Example
One example is how the IT department is almost always linked to every other department. A bottle-neck in the IT department can lead to issues throughout the organisation. When a high degree of dependency is identified, measures can be taken to reduce the effects of any IT issues. This saves resources and ensures that employees can do their jobs at all times.
Swim Lane Diagram template
To set-up your own Swim Lane Diagram, you can use this ready-to-use template / worksheet in a .PPTX format.
Download the Swim Lane Diagram template
This template is exclusively for our paying Toolshero members. Click here to see if a membership is something for you!
Now It’s Your Turn
What do you think? Do you recognise the explanation about swim lane diagrams? Do you use business process mapping (BPM) to visualise and optimise business processes in your organisation? What else is important when using business process diagrams? What other forms of business process mapping are you familiar with? Do you have any tips or additional comments?
Share your experience and knowledge in the comments box below.
More information
- Hunt, V. D. (1996). Process mapping: how to reengineer your business processes. John Wiley & Sons.
- Rohwer, D. (2013). U.S. Patent No. 8,402,480. Washington, DC: U.S. Patent and Trademark Office.
- Rummler, G. A., & Brache, A. P. (1995). Improving performance. San Francisco: Jossey-Bass.
- Rummler, G. A., & Brache, A. P. (2004). Business process management in US firms today. Rummler-Brache Group.
How to cite this article:
Janse, B. (2019). Swim Lane Diagram. Retrieved [insert date] from Toolshero: https://www.toolshero.com/problem-solving/swim-lane-diagram/
Published on: 05/08/2019 | Last update: 08/12/2023
Add a link to this page on your website:
<a href=”https://www.toolshero.com/problem-solving/swim-lane-diagram/”>Toolshero: Swim Lane Diagram</a>
Ben Janse
Ben Janse is a young professional working at ToolsHero as Content Manager. He is also an International Business student at Rotterdam Business School where he focusses on analyzing and developing management models. Thanks to his theoretical and practical knowledge, he knows how to distinguish main- and side issues and to make the essence of each article clearly visible.

Related ARTICLES

DMADV Process: the Basics and Steps

HACCP plan explained

Measurement System Analysis (MSA)

Philip Crosby biography, quotes and books

Norbert Wiener biography and books