RASCI Chart explained including an example

RASCI Chart: This article explains the RASCI Chart practically. It gives an explanation of what a RASCI chart is, provides tips on using one and covers two shortcomings to take into account. The article explains the difference between the RASCI Chart and the RACI Chart, or matrix, and explains the different roles within this method. You will also find a practical example of this chart, and a brief summary. Enjoy reading!
What is a RASCI Chart?
The RASCI Chart is a method used to describe the roles and responsibilities of individuals within a project or other line work. The method is also called RASCI model or RASCI method. RASCI is an acronym and stands for the following five roles:
- Responsible
- Accountable
- Supportive
- Consulted
- Informed
Sometimes a sixth element is used: Out of the Loop (O). In that case, the acronym CAIRO is used.

RASCI Chart versus RACI Chart
The RASCI chart is an extension of the RACI Matrix. These models are almost the same. The RACI Matrix lacks the supportive role.
For smaller projects the RACI Model and also the Responsibility Assignment Matrix (RAM) could be good options. Is it a larger project or task and is there a risk that too much responsibility will fall on the plate of others? Then, adding the supporting role is a good idea. In that case, use the RASCI variant.
The method is a tool to visualize the complete division of roles and powers within an organization in a very simple way. The method is based on the Responsibility Charting technique, which was developed in the United States and is also a very popular method within software development.
Officers may be assigned multiple roles and responsibilities within a process. These therefore fulfill several roles in the model at the same time.
Process model
All roles and responsibilities within a certain framework can be represented in a process model. This process model also shows the relationships between roles and responsibilities.
With a completed process model it becomes clear to all employees within a project or task what their responsibilities are and how their role is connected with other roles.
Roles within the RASCI chart
The five roles defined in this method are briefly explained below.
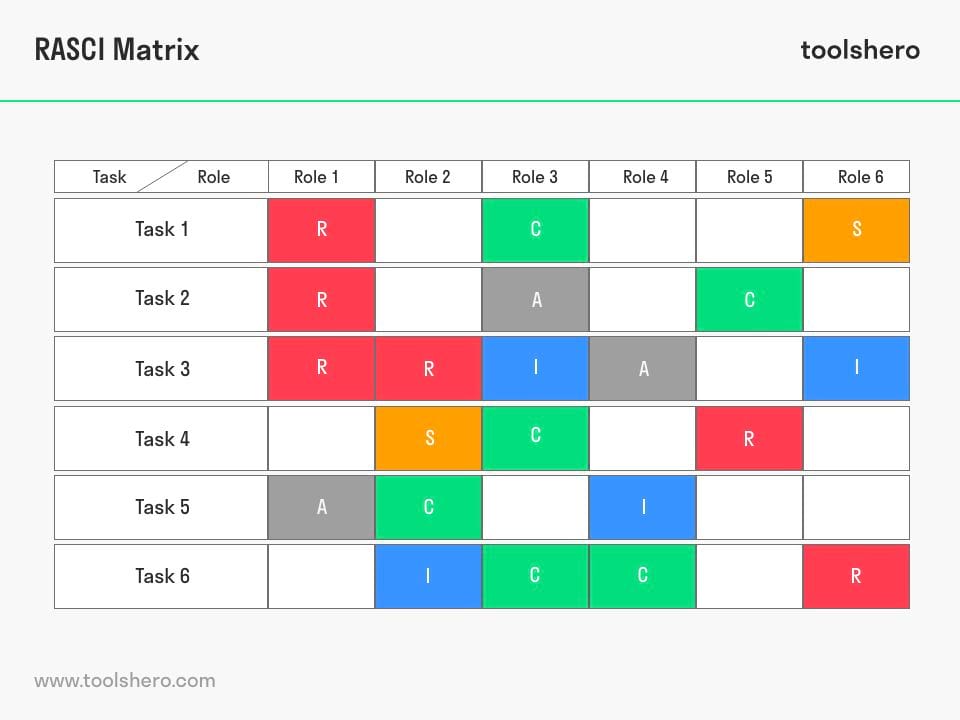
Figure 1 – RASCI Chart Example
Responsible
The person assigned this role is responsible for a process or task. This person also reports to the person who is accountable.
Accountable
The person who is accountable is completly responsible and accountable (decision maker) for the total project or task. This person also assesses whether the end product is satisfactory or unsatisfactory.
Support
The support role is assigned to the person who provides support to the process or project and performs various activities (task or deliverable) for its benefit . These could be multiple people that are a part of the project or task.
Consulted
The consulted role is assigned to the person to be consulted, or for which approval or other input is sought by the person who has assumed the responsible role.
Informed
The person with this role and responsibility is informed about decisions, progress and results regarding the project or task.
Working without a fixed division of roles and responsibilities
Some teams start a project without making clear agreements in advance about roles and responsibilities by means of a RASCI matrix. Toolshero says about this: try to avoid this. Not using a RASCI matrix or other role division model can have a negative impact on the team and on the performance.
Not working with such a tool ensures that a way in which a team can work in peace is not developed. Team members will blame each other the moment something goes wrong. A blames B, B blames C, and so on. It is crucial that each individual within a team is given a task and role. Only then can everything be crystal clear.
Tips for working with a RASCI chart
This method offers several advantages when used correctly. Below are some tips to get the most value from the method.
- Make sure at least 1 person is responsible for each task (R). If there is no responsible person, the work will not be carried out.
- Also, do not assign too many responsible persons to a single task. If everyone thinks someone else is doing the job, the work can be left behind. There must be a degree of urgency.
- Provide a single person with final responsibility for each task. This means that someone is always ultimately responsible for a task or activity. Sometimes this is a person who has the responsible (R) role, but it can also be someone else.
- Check if too many R’s or A’s are assigned to a single person. Too many of these roles can mean overload.
- Too many I’s and C’s means that those responsible (R) do not have enough resources at their disposal. They have to consult too often.
Pitfalls of using a RASCI chart
The method suffers from two shortcomings that must be considered. The first is rigidity. It can happen that organizations may interpret the division of roles too rigidly. This can lead to pigeonholing, such as: this is part of my task, not this, neither this, but that yes. Or: I’m not responsible for this, so I’m not doing this. Or: I can do this, but I am not allowed to do it according to my assigned roles and responsibilities.
Modern and flexible organizations know from experience that such a division of roles cannot be static. There is a good chance that a model that is being created now will no longer be relevant in a year’s time, because in practice employees take on parts of other roles and responsibilities.
That is also the basis of the second shortcoming. Because these roles and responsibilities can change, often a matrix arises that is filled out in too much detail, hidden in an Excel file somewhere on a cloud storage facility. A cluttered table leads to less use. Matrixes can easily become too complex. Watch out for this.
Summary RASCI chart
The RACI chart is a project management tool that helps clarify roles and responsibilities within a project team. It stands for Responsible, Accountable, Consulted, and Informed, and is particularly useful for complex projects where multiple team members and subject matter experts are involved. The chart clearly outlines who is responsible for completing specific tasks, who is accountable for ensuring those tasks are completed, who should be consulted for input or advice, and who should be kept informed of progress. Creating a RASCI chart can help ensure that everyone on the project team knows what is expected of them, and can also be a supportive tool for subject matter experts who may not be part of the core project team but still need to be consulted or informed.

Now it is your turn
What do you think? Do you recognize the explanation about RASCI? Do you work with a clear method for division of roles and responsibility? Do you think more teams would benefit from adopting such a method? What other techniques do you know for managing roles and responsibilities? Do you think that confusion often arises about roles and responsibilities if this is not well defined?
Share your experience and knowledge in the comments box below.
More information
- Ahmed, M. R. (2019). The RACI Matrix and its implications: a case of Unilever.
- Haughey, D. (2017). RACI matrix. Project Smart.[Viitattu 28.8. 2017]. Saatavissa: https://www. projectsmart. co. uk/raci-matrix. php.
- Morgan, R. (2008). How to do RACI charting and analysis: a practical guide. Project Smart. Reino Unido.
- Suhanda, R. D. P., & Pratami, D. (2021). RACI Matrix Design for Managing Stakeholders in Project Case Study of PT. XYZ. International Journal of Innovation in Enterprise System, 5(02), 122-133.
How to cite this article:
Janse, B. (2022). RASCI Chart. Retrieved [insert date] from Toolshero: https://www.toolshero.com/project-management/rasci-chart/
Original publication date: 07/10/2022 | Last update: 05/11/2023
Add a link to this page on your website:
<a href=”https://www.toolshero.com/project-management/rasci-chart/”>Toolshero: RASCI Chart</a>
Ben Janse
Ben Janse is a young professional working at ToolsHero as Content Manager. He is also an International Business student at Rotterdam Business School where he focusses on analyzing and developing management models. Thanks to his theoretical and practical knowledge, he knows how to distinguish main- and side issues and to make the essence of each article clearly visible.

Related ARTICLES

Agile Method of Software Development

Project budget explained: theory and a template

Agile Crystal Method explained


Business Requirements Analysis Framework and Steps