Statistical Process Control (SPC) explained

Statistical Process Control (SPC): This article explains Statistical Process Control (SPC) in a practical way. This article highlights what is (definition, meanining and it’s origin), the principles of SPC and what purpose charts serve in this context. You will also find practical examples of situations where SPC is valuable, and a detailed explanation of the entire process of SPC in real life situations. Enjoy reading.
What is Statistical Process Control (SPC)? The basics explained
Definition of Statistical Process Control
Statistical process control (SPC) is a method used in quality management. The method uses statistical methods to monitor and control a process. It ensures an efficient process with fewer errors and waste. In principle, SPC can be applied to any process where it is possible to measure whether the conforming products output meets the required product specifications or not.
This method is applied in two phases. The first stage involves the initial setup of the process. The second phase is the regular production phase of the process.

An important advantage of SPC in addition to reducing waste is that applying the method can lead to a reduction in the time it takes to produce products.
Meaning
Statistics is a discipline mainly concerned with collecting, organizing, summarizing, analyzing and drawing conclusions from large amounts of data.
A process is a combination of people, materials, methods, machines, measurements and time to convert certain inputs into something new. Control is about managing a system, method, machine and the measurements.
Origin
SPC has been used in Western industries since the 1980s. The method was developed in the United States. Walter Andrew Shewhart is credited with developing the so-called control chart and the idea that a process could be statistically controlled in 1924, when he was working at Bell Telephone Laboratories.
The SPC principles have subsequently been incorporated into the management philosophy of William Edwards Deming at the start of World War II. SPC became especially popular after the Japanese industry implemented it on a big scale.
Examples of Statistical Process Control (SPC)
Consider the following example. Jeffrey has his own shoe manufacturing business. The output his factory delivers, is usually good and of great quality. But every now and then, one of Jeffrey’s shoes comes out of the factory with a deformed heel. What can he do to ensure the quality of his shoes is always high? Statistical Process Control is one way to ensure high quality in this case.
Another example. Many standards for food safety, including ISO standards, require businesses to conduct statistical analysis to achieve certification. Many local bakeries are therefore required to use SPC and other statistical analysis tools to make use of collected data and control their activities.
There are typically about four steps in a SPC process. The process is based on the PDCA cycle by Edward Deming. These are briefly explained below.
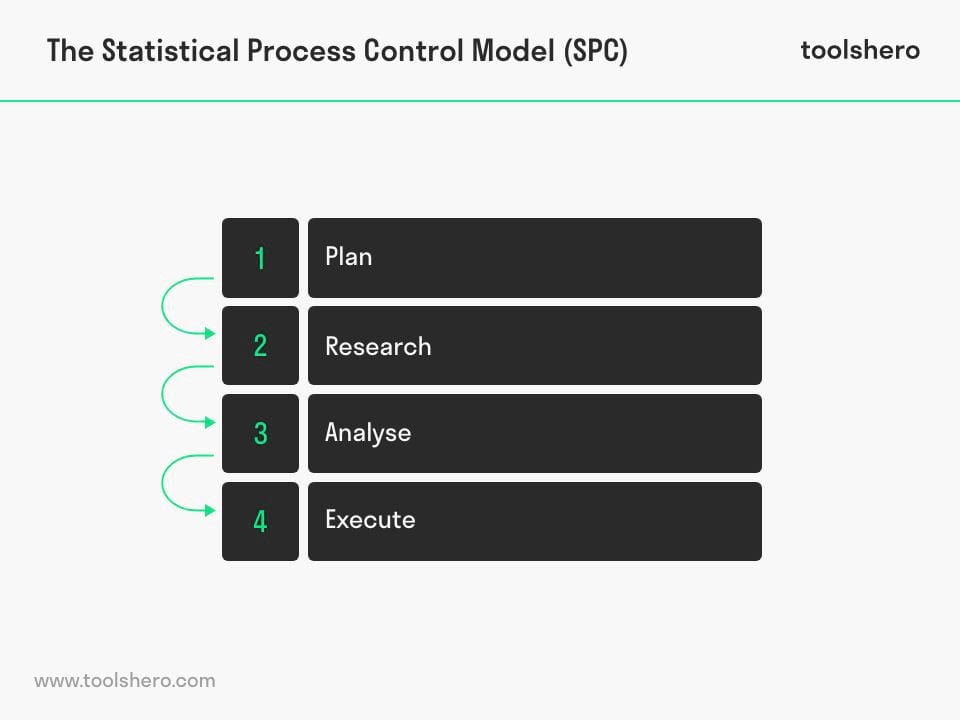
Figure 1 – Statistical Process Control (SPC)
Step 1: plan
In the first step, the root of the problem is identified and corrective actions are taken to address it. A corrective action is taken immediately after the problem is identified.
Step 2: research
The second step in SPC is research or experimentation. If problems arise, statistical process control software helps to analyze this problem and allows the user to quickly and easily make a technical decision that most likely solves the problem. This support is available throughout the product development lifecycle.
Step 3: analyze
Using the SPC software and associated digital test data, the user gets a complete picture of the production statistics. In this phase, all possible problems are described in detail, after which the data is forwarded to the Research & Development (R&D) department. Ultimately, the goal is to improve product quality and customer satisfaction.
Step 4: act
The last phase is an evaluation phase. If corrective actions and implementation of R&D suggestions have solved the problem, work on additional improvements. A product or system is almost never fully developed. If the result is not yet successful, look for other ways to optimize the process.
Charts in Statistical Process Control
Control charts or process control diagrams are simple diagrams in which several points are connected together on an x – and y-axis, where the x-axis represents time. The points included in the diagram are often averages of subgroups or individual measurements. SPC Charts analyse process performance by plotting data points, control limits, and a center line.
Shewhart at Bell Laboratories developed the control chart and the concept that a process chart could be in statistical control.
SPC control charts show exactly the pros and cons of a process in a graphical way. They help to easily identify the difference between measurements over a period of time.
More specifically, the graph shows how a certain process is performing and what changes are possible in the process. They help identify bottlenecks, wait times and other delays. Compared to other quality control methods, the SPC control chart has the great advantage that it clearly shows the consistency of a process.
A term that is often associated with these charts is common cause variation. Common cause variation is when the control chart of a process measure shows a random pattern of variation with all points within the control limits. When a control chart shows common cause variation, a process measure is said to be in statistical control or stable.
Types of control charts
There are two types of control chart distinguished by the type of data used: variable and attribute data. Variable data comes from measurements on a continuous scale, such as: temperature, time, distance, weight. Attribute data is based on upon discrete distinctions such as good or bad, percentage defective, or number of defects per hundred.

Now It’s Your Turn
What do you think? Do you recognize the explanation about Statistical Process Control? Is SPC used in your work environment like manufacturing processes? What other process control methods do you know? What other techniques and methods do you think can be combined with this method? Do you have any tips or comments?
Share your experience and knowledge in the comments box below.
More information
- Oakland, J. S. (2007). Statistical process control. Routledge.
- Woodall, W. H., & Montgomery, D. C. (1999). Research issues and ideas in statistical process control. Journal of Quality Technology, 31(4), 376-386.
- MacGregor, J. F., & Kourti, T. (1995). Statistical process control of multivariate processes. Control engineering practice, 3(3), 403-414.
How to cite this article:
Janse, B. (2022). Statistical Process Control (SPC). Retrieved [insert date] from Toolshero: https://www.toolshero.com/quality-management/statistical-process-control/
Published on: 06/27/2022 | Last update: 03/29/2023
Add a link to this page on your website:
<a href=”https://www.toolshero.com/quality-management/statistical-process-control/”>Toolshero: Statistical Process Control (SPC)</a>
Ben Janse
Ben Janse is a young professional working at ToolsHero as Content Manager. He is also an International Business student at Rotterdam Business School where he focusses on analyzing and developing management models. Thanks to his theoretical and practical knowledge, he knows how to distinguish main- and side issues and to make the essence of each article clearly visible.

Related ARTICLES

DMADV Process: the Basics and Steps

HACCP plan explained

Measurement System Analysis (MSA)

Philip Crosby biography, quotes and books

Norbert Wiener biography and books