
BCG Matrix explained including an example

BCG Matrix: this article explains the BCG Matrix in a practical way. After reading you will understand the basics of this powerful marketing and portfolio analysis tool. This article also contains a downloadable and editable BCG matrix template to get started. Enjoy reading!
What is the BCG Matrix? The theory
The BCG Matrix is an assessment model in which products or (functional) business units are assessed on two aspects. First, the relative market share that a certain product or its business unit has with respect to the competition. Second, the market growth potential for that product or its business unit.
For manufacturing businesses it is very functional to have a prior understanding of the market position of their products. Besides knowing which products need to be promoted more, they will know which products will be successful.

For this purpose, the American Boston Consulting Group (BCG) developed the BCG Matrix in which products or (functional) business units are assessed on two features:
- The relative market share that a certain product or its business unit has with respect to the competition.
- The market growth potential for that product or its business unit.
The definition of the BCG Matrix
The BCG Matrix is a portfolio management framework that helps companies decide how to prioritize their different businesses. It is used by organizations with high growth rates and a high market share in many high growth markets. This assessment model is also known as the Boston Matrix, the Growth Share Matrix or Boston Consulting Group Matrix.
BCG Matrix categories and an example
The absolute values of the axes are dependent on the line of business or industry. This is why the axes are often indicated with high and low. Based on the BCG Matrix a product or business unit can be in one of the four following categories:
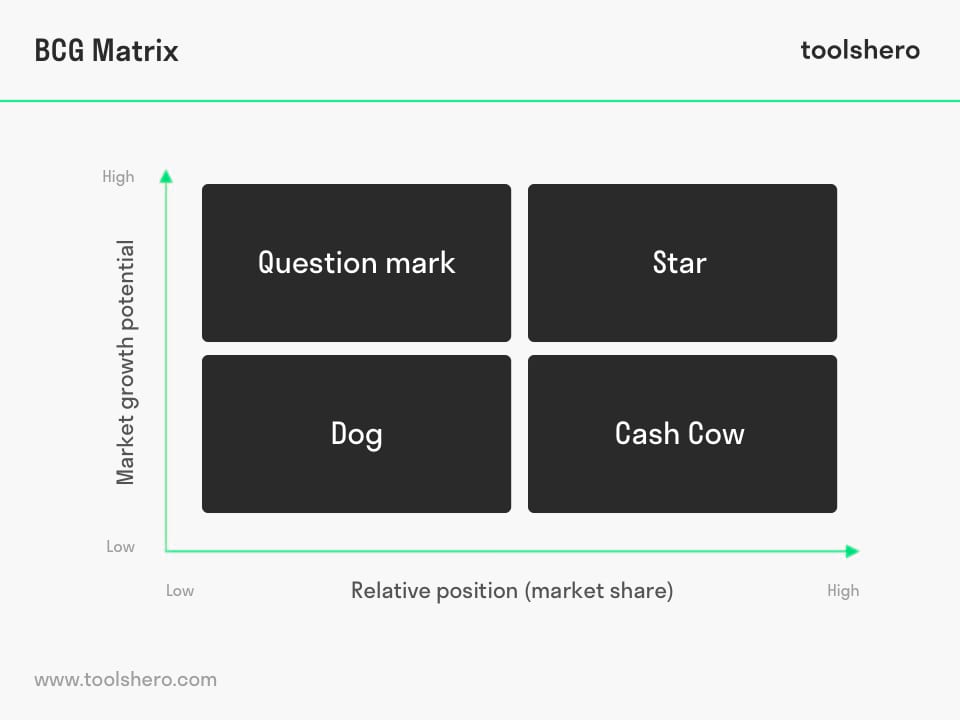
Figure 1 – BCG Matrix: the four quadrants
1. Question mark
It is still a big question (problem child / wild cat) what the product is going to do on the market. Often it is concerns a product that is to be introduced and is unknown with a very small market share. It is still uncertain whether it can become a Star or a Cash Cow.
2. Star
The market share of the product grows like a ‘rising star’ in the growth market. With targeted investments such as innovations and adjustments to the product, this lead in the market is maintained. The product will become more and more familiar.
3. Cash Cow
The product is a ‘milch cow’ and big money is made from this. The revenue from the Cash Cow is invested in other products.
4. Dog
When a product is in the underdog position, it has a small market share in a mature market. If this product is no longer of strategic importance to the company, this product will be divested.
Sequence
The most ideal development path of a product is that from Question mark to Star and Cash Cow. The route to Dog should be postponed for as long as possible. Some products remain stuck as a Question mark and become Dogs at an early stage. This is a costly affair for a business as investments have been made in the product and in the promotion around the product.
The route of a product via the ideal development path will eventually bring in money with which investments can be made in other and/or new products that will be deployed in the market as a Question mark. However, for the sake of the continuity of the Cash Cows and / or Stars, Dogs are also necessary.
Example: Fast food restaurants in America almost always offer soft drinks (Dog) for free in combination with a hamburger (Cash Cow). As a consequence, the sale of the Cash Cows is guaranteed.
The BCG Matrix and Strategic choices
Operational management can be determined from the BCG matrix. For a company it entails a lot of risk to fully aim at one of the four categories and from a strategic point of view it is better to distribute the assortment over all four categories.
Some strategic choices that are in conformity with the BCG matrix could be:
1. Build strategy
Create a new brand and a new target audience by means of a Question Mark.
2. Hold strategy
Maintain this success and benefit from market growth by means of a Star.
3. Harvest strategy
Make as much money as possible with the product by means of the Cash Cow. This can be achieved by improving or renewing the product or by manufacturing by-products.
4. Divest strategy
Abandon the investment in the product by means of a Dog; the market is saturated or there is no or little interest in the product.
Criticism on the BCG matrix
Notwithstanding the fact that the BCG matrix is applied by many businesses, it has also been criticized:
- The market share of the matrix does not guarantee profitability.
- The BCG matrix does not consider decreasing markets enough; Cash Cows could disappear without reason.
- Market growth is treated as a given, whereas a business could give the market an incentive.
- Both axes have been assigned the same value. In practice, this value can depend on the strategy.
- The coherence as regards content between products and product groups is not incorporated.
- The BCG matrix does not show what the competition is doing.
- The BCG matrix may oversimplify the assessments of the facts
BCG Matrix template
Get a clear understanding of the market position of products and services of either your business or competitors, with this BCG Matrix template.
Download the BCG Matrix template
This template is exclusively for our paying Toolshero members. Click here to see if a membership is something for you!
It’s Your Turn
What do you think? Is the BCG Matrix applicable in today’s modern economy and marketing? Do you recognize the practical explanation or do you have additions? What are your success factors for the good BCG matrix set up?
Share your experience and knowledge in the comments box below.
More information
- Hambrick, D. C., MacMillan, I. C., & Day, D. L. (1982). The product portfolio and profitability—a PIMS-based analysis of industrial-product businesses. Academy of Management Journal, 25(4), 733-755.
- Henderson, B. D. (1973). The experience curve–reviewed. IV. The growth share matrix of the product portfolio. Perspectives.
- Smith, M. (2002). Derrick’s Ice–Cream Company: applying the BCG matrix in customer profitability analysis. Accounting Education, 11(4), 365-375.
- Thompson, A. A., Strickland, A. J., Gamble, J. E., & Zeng’an Gao. (2008). Crafting and executing strategy: The quest for competitive advantage: Concepts and cases. McGraw-Hill.
How to cite this article:
Van Vliet, V. (2007). BCG Matrix. Retrieved [insert date] from Toolshero: https://www.toolshero.com/marketing/bcg-matrix/
Original publication date: 03/14/2007 | Last update: 11/08/2023
Add a link to this page on your website:
<a href=”https://www.toolshero.com/marketing/bcg-matrix/”>Toolshero: BCG Matrix</a>
Vincent van Vliet
Vincent van Vliet is co-founder and responsible for the content and release management. Together with the team Vincent sets the strategy and manages the content planning, go-to-market, customer experience and corporate development aspects of the company.

Related ARTICLES

Core Competence Model (Hamel and Prahalad)

Borda Count Method: Basics and an Example


2 responses to “BCG Matrix explained including an example”
It is applicable to each and every business in this world
Great value here! Hands down one of my favorite places to learn about management tools to use in my biz… I love the info here! Keep up the great content.