Break Even Analysis: the Formula and Example
Break Even Analysis: this article explains the concept of a Break Even Analysis. Next to what it is, this article also highlights the components, this concept as a financial tool, the basic Break Even Analysis formula, the importance of cooperation, and the advantages of this type of financial analysis. Enjoy reading!
What is a Break Even Analysis?
The Break Even Analysis (BEA) is a useful tool to study the relation between fixed costs and variable costs and revenue. It’s inextricably linked to the Break Even Point (BEP), which indicates at what moment an investment will start generating a positive return.
It can be graphically represented or calculated with a simple mathematical calculation. A Break-Even Analysis calculates the size of the production at a certain (selling) price that is necessary to cover all the costs that have been incurred.

Break Even Analysis components
To understand how this analysis works, it’s wise to at least mention the following cost concepts.
Fixed costs
Fixed costs are also called overhead. These costs are always occur after the decision to start an economic activity and they relate directly to the level of production, but not the quantity of production. Fixed costs include (but are not limited to) depreciation of materials, interest costs, taxes and general overhead costs (labour costs, energy costs, depreciation costs).
A carpentry business that mainly makes tables, chairs and closets, employs 50 people. The business has a large number of fixed costs.
It’s about costs that come back every month and stay the same, and can only change after a year. Think for instance of salaries, monthly energy bills and the depreciation costs of current assets (including machines) and fixed assets (such as a building).
Variable costs
Variable costs are costs that change in direct relation to the volume of production. This concerns for instance selling costs, production costs, fuel and other costs that are directly related to the production of goods or an investment in capital.
For a carpentry business, mainly the costs for raw materials, auxiliary materials, semi-finished goods such as wood, nails and copper handles, are variable. If they are producing 50 closets per month, they use less than when they produce 75 closets in some other month. Therefore, these costs vary every month.
Financial Tool
The Break Even Analysis is a handy tool to decide if a company should or should not start producing and selling a product.
In addition, you can calculate the Break Even Point (BEP), also known as the critical point. It is the turnover at which the total revenue would equal the total costs. In that case, the organisation would break even and both the fixed and variable costs will be earned back.
If the turnover is lower than the total costs, it’s a loss. Everything over this critical point can be booked as profit.
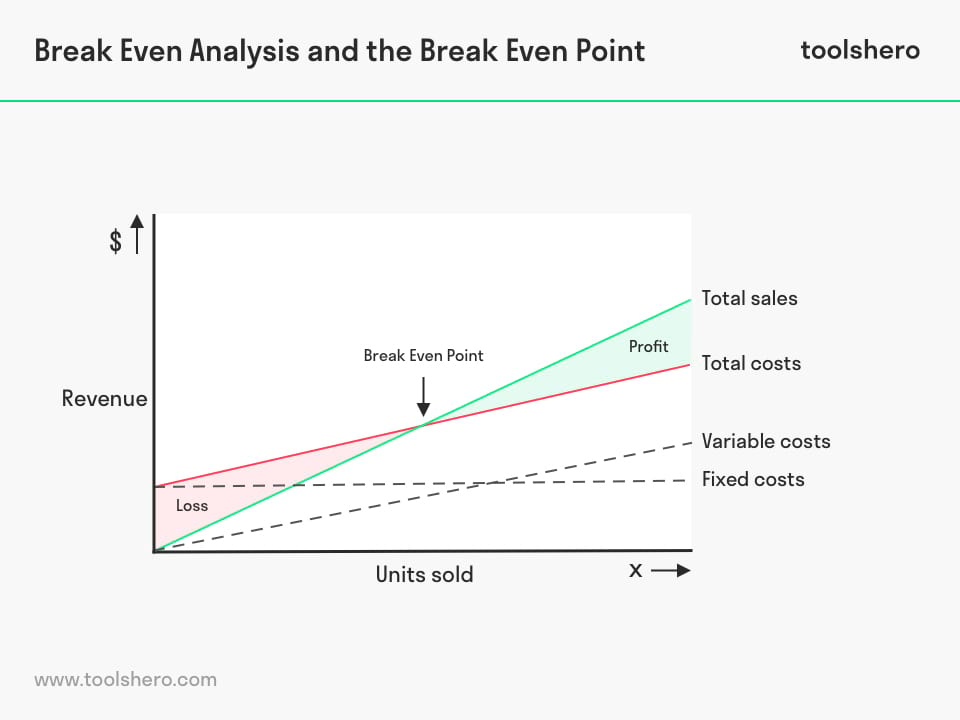
Figure 1- Break Even Analysis model
Break Even Analysis formula
In order to calculate the Break Even Point within the Break Even Analysis, you need certain data, namely the fixed costs, the selling price of the product and the variable costs per product.
The Break Even Point is determined by the moment when the fixed costs have been earned back. That only happens because of the so-called contribution margin; the selling price minus the variable costs.
When the fixed costs are divided by the contribution margin, you get the Break-Even Point. See the picture below for the Break-Even Point formula:
Break Even Point = fixed costs / ( selling price – variable costs )
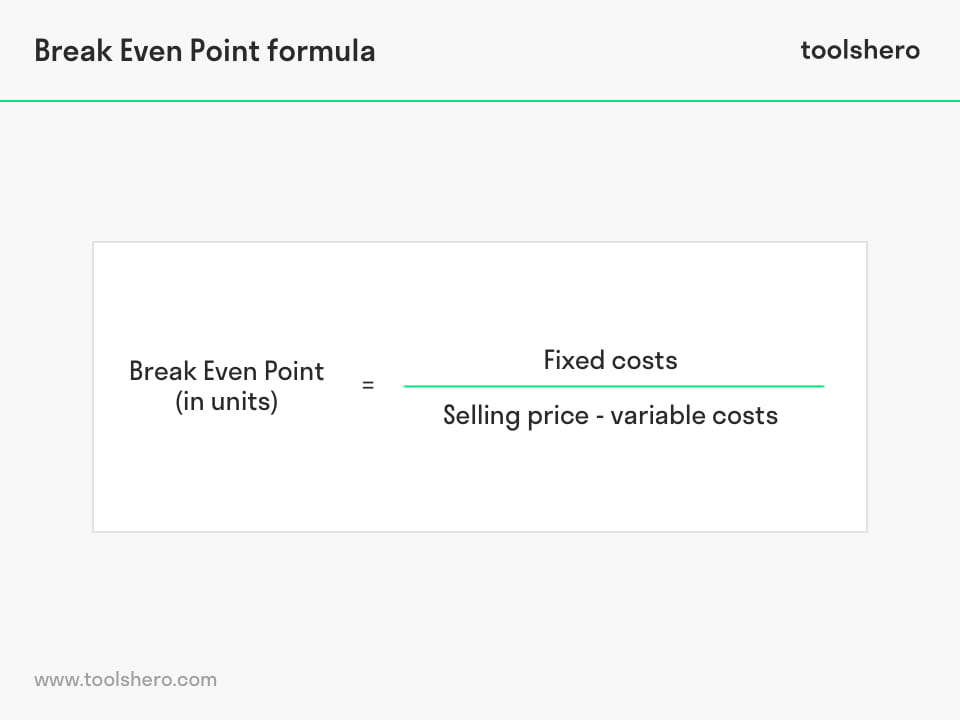
Figure 2 – Break Even Analysis formula
Break Even Analysis example
The previously mentioned carpentry business is planning to make a new closet.
It’s a Bohemian model of rough, white-washed woos with two doors and a drawer at the bottom. The closet is almost two metres high, 1.50 metres wide and 0.5 metres deep. There are shelves in the closet and there is an area to hang up clothes, making it suitable as a wardrobe. It would be a good idea for the director to first consider certain data before he decides to start production of the closet.
- The expected selling price is $1,000.
- The fixed costs average $210,000 per year (monthly labour costs, energy costs, interest and depreciation costs).
- The purchasing price of the wood, auxiliary materials and semi-finished products is $400 per closet and make up the variable costs.
With this data, the director will determine the Break-Even Point and he makes the following calculation:
Break Even Point = $210.000 / ( $1000 – $400 ) = 350 items
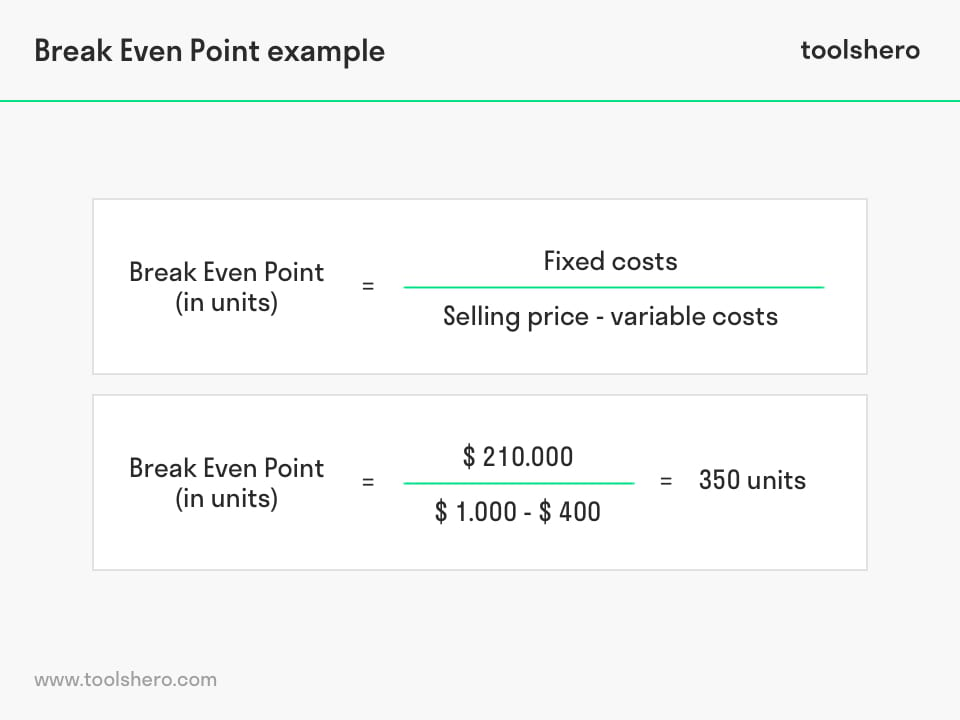
Figure 3 – Break Even Analysis example
That means that the carpentry business won’t break even until they sell 350 of these closets, and won’t make a profit until the 351th one.
Cooperation
The above shows that good communication and pleasant cooperation between the Purchasing, Sales and Production departments of a business is very important. Together they will reach a joint conclusion.
It might be impossible for the Sales department to sell more than 350 of these closets.
It might be feasible, but the $1,000 selling price might be too high, leading to the salespeople recommending a more competitive selling price of $750. When that happens, something changes in the Break-Even Point and they will need to sell more than 350 closets before making a profit.
The Purchasing department on the other hand can make sure that raw materials, auxiliary materials and semi-finished products are purchased at more affordable rates, reducing the variable costs. Together with the Sales department, they can also opt to stick to the high selling price, ensuring that they will turn a profit sooner when they sell 350 closets. Lastly, it’s the Production department’s turn.
For them it’s about efficiently handling raw materials. Waste needs to be avoided in order to reduce the variable costs.
An efficient and effective approach will also help with the speed of production, allowing more closets to be produced in less time. Of course, other departments are also linked to this system.
For instance, it’s the Marketing department’s task to offer the closets in an attractive way using various channels, including shops, online shops, design magazines and so on.
Break Even Analysis advantages
The main advantage of a Break-Even Point is that it explains the relationship between costs, production volume and revenue. This analysis can be expanded to show how the changes between fixed and changing cost relations will affect profit levels and the Break-Even Point in for instance product prices or turnovers.
The Break Even Analysis is particularly useful when it is combined with partial budgeting techniques.
The most important advantage to using the method is that it shows the minimally required amount of economic activity, necessary to prevent potential losses. Furthermore, based on the Break-Even Point formula, it’s easy to make additional calculations that provide insight into the profitability of the investment.

It’s Your Turn
What do you think? How do you apply the Break Even Analysis in your business life? Do you recognize the practical explanation or do you have more additions? What are your success factors for conducting financial calculations such as the Break-Even Point?
Share your experience and knowledge in the comments box below.
More information
- Alhabeeb, M. J. (2012). Break‐Even Analysis. Mathematical Finance, 247-273.
- Cafferky, M. (2010). Break Even Analysis. Business Expert Press.
- Gutierrez, P. H., & Dalsted, N. L. (1990). Break-even method of investment analysis. Colorado State University Cooperative Extension.
- Sadiku, M. (2017). Practical Guide on Writing a Persuasive Business Plan: Sample Business Plan, Break-even Analysis, and Detailed Business Plan Outline. Independently published.
How to cite this article:
Mulder, P. (2017). Break Even Analysis (BEA). Retrieved [insert date] from Toolshero: https://www.toolshero.com/financial-management/break-even-analysis/
Original publication date: 02/27/2017 | Last update: 05/28/2024
Add a link to this page on your website:
<a href=” https://www.toolshero.com/financial-management/break-even-analysis/”>Toolshero: Break Even Analysis (BEA)</a>
Related ARTICLES

Solvency Ratio: the Formula and Basics

Internal Rate of Return: Definition and Calculation

Investment Management explained