Return on Assets Managed (ROAM)

Return on Assets Managed: this article explains Return on Assets Managed (ROAM) in a practical way. After reading it, you will understand the basics of this powerful financial ratio and you will be able to calculate this financial measurement.
What is Return on Assets Managed (ROAM)?
Return on Assets Managed (ROAM) is a financial performance measurement that can be used to evaluate the overall health of a company. More specifically, Return on Assets Managed can be used to assess if a reasonable income has been generated with the assets under its control. For this reason, the computation measures the productivity of the assets being managed.
ROAM is additionally expressed in a percentage. It is different than Return on Assets (ROA), which is another measure to analyze a company’s health. The difference between ROA and ROAM is that ROA takes into consideration the average total assets of an investment and ROAM takes into account the assets that are being managed.

Return on Assets Managed (ROAM) is also useful to help make investment decisions, but it can also help to identify and manage risks if it is used correctly.
Return on Assets Managed components
ROAM can be calculated in two ways. Both use different inputs, but to understand how the ROAM model works, it is first essential to understand all components of both computations. The following inputs are needed to compute both ROAM calculations:
Operating income
It is crucial to understand that operating income is not the same at net income. Operating income is the company’s income after deducting the firm’s operating expenses. Net income is the company’s profits after subtracting all costs, including tax, cost of debts, and other expenses. Operating income is therefore calculated by only deducting operating expenses from gross profit.
In order to calculate operating income, the first step is to determine total sales, which can be calculated by multiplying the sales in units with the selling price. From this point, the next step is to deduct the firm’s cost of goods sold, which could include fixed and variable costs. We now have calculated the gross profit.
Operating income can next be calculated by deducting the operating expenses from the gross profit. Operating expenses could include but are not limited to wages, advertising, insurance, depreciation, and costs of utilities.
Operating income formula
Operating income = Gross profit – Operating expenses
Assets
The assets of a company are all economic resources that are owned by a business and are expected to generate positive cash flows in the future. These assets may convert directly into cash. It is also possible that these assets indirectly convert into cash. This happens for example when assets are being used in the operations to create other assets such as goods to be sold.
Assets are generally tangible but in some cases it can also be intangible. Assets are intangible when it has the form of a valuable right such as a patent right held by a company but also amounts that are not yet collected from customers.
Asset turnover
Asset turnover shows how efficient the company is utilizing its assets to generate revenues. The goal of companies is to realize as high as possible turnover ratio because it demonstrates how much revenue the company is generating per amount of assets.
It is important to understand that asset turnover varies per company and industry. For example, service companies generally have fewer tangible assets than manufacturing companies. Calculating and comparing asset turnover with these two kinds of companies would not make sense in this case.
Asset turnover is calculated by dividing total sales with average total assets. It is essential that asset turnover is calculated annually because of the average total assets. Usually, assets are calculated at the beginning of a fiscal year and the end of a fiscal year.
In order to calculate asset turnover, the first step again is to calculate total sales. Total sales should next be divided with average total assets, which is the assets at the beginning of the fiscal year and the end of the fiscal year divided by 2.
Asset turnover formula
Asset turnover = Total sales / Total assets
Operating profit margin
The operating profit margin is a financial ratio that shows the profits as a percentage of sales. The measurement is used to analyze the company’s effectiveness in earning profits. Operating profit is a synonym for operating income.
Therefore, after the costs of goods sold and all other expenses have been deducted from the revenue, this number must be divided by the revenue to calculate the operating profit margin.
Return on Assets Managed formula
As explained, Return on Assets Managed can be calculated in two ways. It does not matter which methods to use because both will calculate the same outcome.
Method 1
Return on Assets Managed = Operating Income / Assets Managed
Method 2
Return on Assets Managed = Asset Turnover × Operating Profit Margin
Return on Assets Managed example
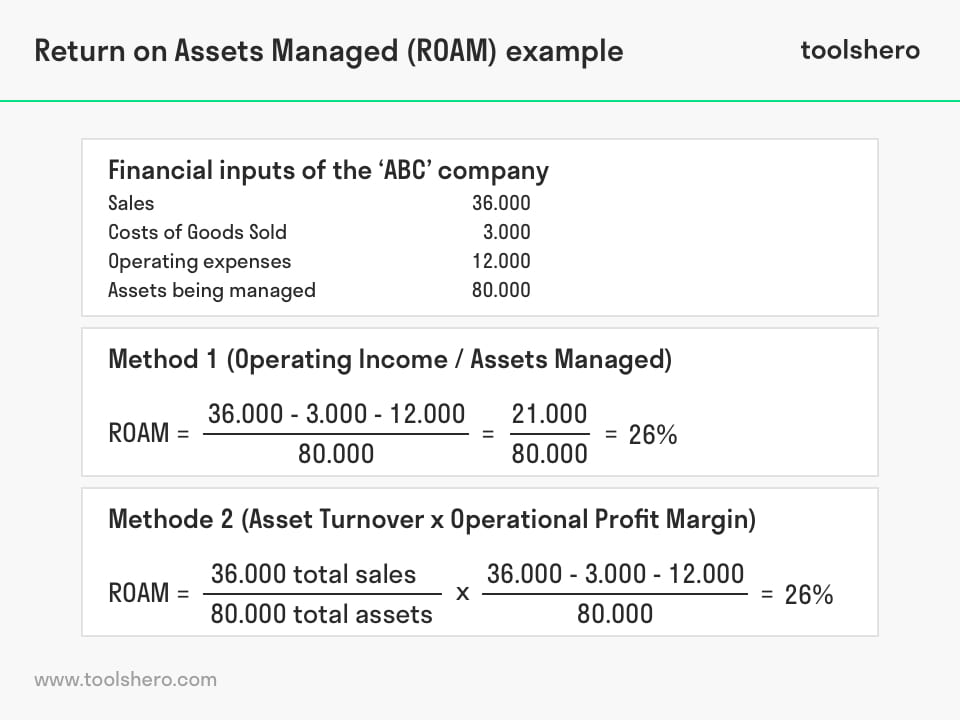
Consider the following example and assumptions to calculate Return on Assets Managed (ROAM). Company ABC established a year ago and started designing and manufacturing pens. ABC designs and assembles these pens with a make-to-stock manufacturing approach and sells its products directly to its consumers.
ABC offers customizable pens so that exclusive designs can be offered as gifts. This is an addition to their USP, and thus, part of their Customer Value Proposition. Recently, ABC recorded the following financial inputs in:
- Sales 36.000
- Cost of Goods Sold 3.000
- Operating expenses 12.000
- Assets being managed 80.000
When ABC calculates the Return on Assets Managed via method 1 (operating income / total assets managed), the calculation would be as follow:
Return on Assets Managed = (Operating Income)/(Assets Managed) = (36.000-3000-12.000)/(80.000) = (21.000)/(80.000) = 26%
ABC could also calculate the ROAM via method 2 (Asset Turnover × Operating Profit Margin). The calculation would in this case be as follow:
Return on Assets Managed = (36.000 total sales )/(80.000 total assets) × (36.000-3000-12.000)/(36.000) = 26 %
As shown in the previous examples, it does not matter which formula to use to calculate ROAM. The bottom line remains that the percentage of ROAM shows how efficient and effective the company is making use of the assets that are being managed.
When ROAM is applied once, it does not immediately show the effectiveness of the utilization of assets. When a firm, for instance, decides to invest in a new building, the ROAM percentage will substantially decrease. It requires time before the ratio will increase again, and for this reason, it is important to understand what causes the ratios to rise or fall.
It is in addition also best to apply ROAM annually. Trends can in this way be identified, and if necessary, adjustments for improvement can be made.
If ROAM is used to compare the organization’s effectiveness with other organizations, these organizations must be similar because the type of industry influences the percentage of the ROAM. If the comparison-company is not similar or operate in a different industry, benchmarking organization’s performance would not make sense.
In addition, when companies are benchmarked with other organizations, the best way is to use multiple financial ratios such as gross profit rate, return on equity, and operating expense Ratio, current- and quick ratio, working capital, and inventory turnover rate. These are additionally used to measure profitability but also the extent to which a company is able to pay its debts.
The importance of the measurement
Using Return on Assets Managed as a tool to determine an organization’s effectiveness has some great advantages. Since the calculation is concerned with the profitability of the business, it could demonstrate if an element of business needs to be improved.
It is an important measurement because it integrates assets turnover which arranges the cash-to-cash cycle, but it additionally takes into account profits, and profit margin. These are crucial inputs because they contribute to showing the overall health of a company.
Asset productivity also drives ROAM. It means that when managers attempt to improve Return on Assets Managed, the likelihood that organizational efficiency and effectiveness increases are high. For this reason, using ROAM is helpful for any business, regardless of its size.

It’s Your Turn
What do you think? Are you familiar with the ROAM model? Do you apply the Return on Assets Managed in your business? Do you recognize the practical explanation or do you have more additions?
Share your experience and knowledge in the comments box below.
More information
- Asmi, T. L. (2014). Current Ratio, Debt To Equity Ratio, Total Asset Turnover, Return On Asset, Price To Book Value Sebagai Faktor Penentu Return Saham. Management Analysis Journal, 3(2).
- Fairfield, P. M., & Yohn, T. L. (2001). Using asset turnover and profit margin to forecast changes in profitability. Review of Accounting Studies, 6(4), 371-385.
- Keene, M. A., & Peterson, D. R. (2007). The importance of liquidity as a factor in asset pricing. Journal of Financial Research, 30(1), 91-109.
How to cite this article:
Zeeman, A. (2019). Return on Assets Managed (ROAM). Retrieved [insert date] from toolshero: https://www.toolshero.com/financial-management/return-on-assets-managed-roam-model/
Add a link to this page on your website:
<a href=”https://www.toolshero.com/financial-management/return-on-assets-managed-roam-model/”>toolshero: Return on Assets Managed (ROAM)</a>
Alexander Zeeman
Alexander Zeeman is Content Manager at ToolsHero where he focuses on Content production, Content management and marketing. He is also an International Business student at Rotterdam Business school. Currently, in his study, working on the development of various management competencies and improving operational business processes.

Related ARTICLES

Auditing explained including the definition