Value Stream Mapping (VSM)

Value Stream Mapping (VSM): this article explains Value Stream Mapping (VSM) in a practical way. The article begins with a general defintion, followed by information on the steps involved in the process of creating a Value Stream Map, a practical example and the advantages of this model when you use in practice. You will also read about the history and evolution of this method and some practical tips to get started with this tool yourself. Enjoy reading!
What is Value Stream Mapping (VSM)?
Value Stream Mapping is a visual tool used in Lean management to analyze and improve the flow of materials and information through a process, aiming to eliminate waste and optimize efficiency.
VSM Analysis is also known as LEAN Manufacturing VSM.

Value Stream Mapping is process improvement
The objective of VSM, in LEAN Management is a continuous improvement of business processes. The business process is represented diagrammatically. The steps in the process and the flows of information and materials are represented visually in this diagram.
The diagram identifies where improvements need to be made in the process. As a joint idea is created by using the current situation including waste, employees will better understand each other’s work and problems. Furthermore, VSM is a good model to work towards a future situation.
The steps of executing Value Stream Mapping
Before analysing the current situation, the objective of the analysis must be determined first, for instance decreasing lead times or improving quality.
It is important that the objectives are acceptable to the employees. Subsequently, the customer value per product is identified. Then a team is formed that will be involved in the value and information stream activities. The following step-by-step plan can then be used:
Step 1 : Identify the activities (process steps) and assign the right order
In this first step of Value Stream Mapping (VSM), it is essential to identify all the activities in the process and place them in the correct sequence. This involves thoroughly understanding the process and clearly documenting each process step, from beginning to end.
Step 2: Determine frameworks for the roles of the activity
In this step of VSM, it is important to determine the responsibilities and roles within each activity. Identify which team members or departments are responsible for each specific activity. This helps create a clear picture of the parties involved and their contribution to the process.
Step 3: Determine data on processing, waiting and recovering times of an activity in %
To gain an accurate understanding of the performance of each activity, it is important to determine the processing, waiting, and rework times. Measure the time required to perform an activity and calculate the proportion of each type of time relative to the total lead time.
Step 4: Calculate efficiency in the process (operation time versus lead time)
In this step, the efficiency of the process is analyzed by comparing the processing time to the total lead time. By calculating the ratio between these two, it can be determined how much time is actually spent on value-adding activities and how much time is lost to waste.
Step 5: Identify waste in the entire process
The final step of VSM revolves around identifying waste throughout the process. This involves examining each process step and identifying activities that do not add value, such as overproduction, unnecessary movements, waiting times, or defects.
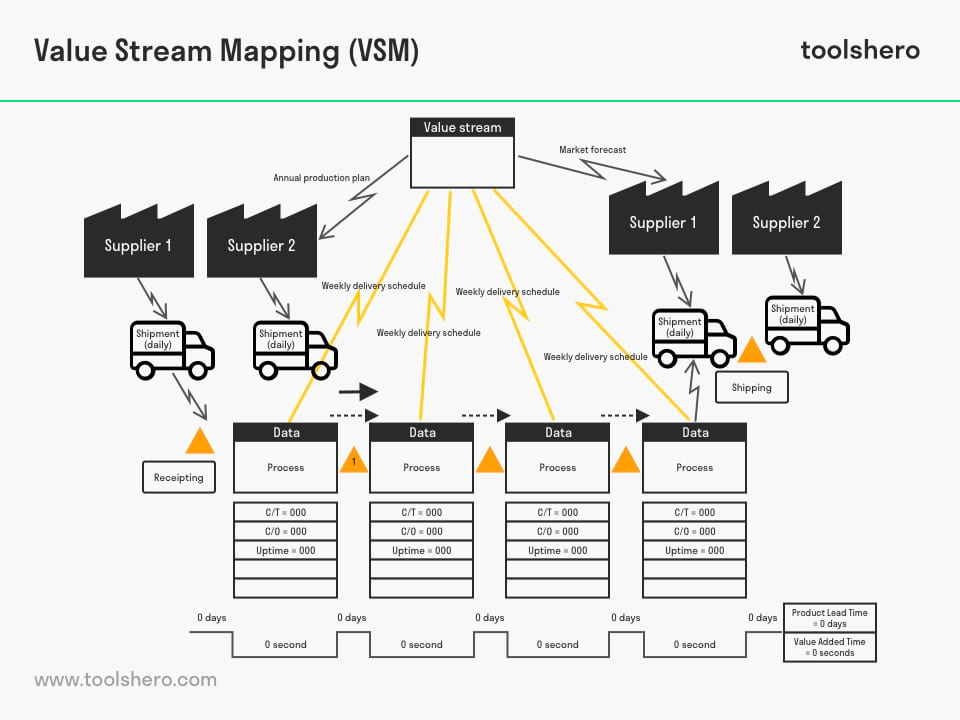
Figure 1 – an example of Value Stream Mapping (Source image: https://www.edrawsoft.com)
History of Value Stream Mapping
Value Stream Mapping has a long history. Diagrams depicting the flow of materials and information date back to 1918 in Charles E. Knoeppel’s book “Installing Efficiency Methods.”
Later, this type of diagram became associated with the Toyota Production System and lean manufacturing, although it had different names at the time.
Key individuals in the development of the Toyota Production System included Shigeo Shingo, Taiichi Ohno, Kiichiro Toyoda, and Eiji Toyoda.
In the 1990s, “value stream map” became an increasingly common term for these methods, and it became a central component of lean in many industries. Value Stream Mapping was also integrated into Six Sigma. Other important figures in the lean movement and VSM include James P. Womack, Daniel T. Jones, John Y. Shook, Karen Martin, and Mike Osterling.
Identifying waste through Value Stream Mapping
The objective of VSM is to provide an overview of the current situation and to identify waste. The source of waste will surface when the ideal and future value stream is detailed. Eight types of waste can be identified:
Waiting
It is wasteful when machines and/or employees must wait before activities can be carried out. Examples: inventory shortage, no instructions and waiting for decisions.
Transport
An inefficient flow of commodities, products, documents creates waste. Examples: bad lay-out and routing of and on the work floor, overlapping of transportation, inefficient agreements about transport.
Overproduction
Producing more than required is wasteful. Examples: not knowing what the customer needs, excess inventory causing obsolescence.
Inventory
A safety stock is necessary but only to a limited extent. A large inventory costs money, takes up much space and loses value (obsolescence).
Defects
The first time an activity is carried out correctly forms part of VSM, It is a waste when errors have to be corrected at a later date. For instance: corrections performed during an activity, subsequent repairs.
Movement
Any wasted movements during the performance of an activity cost time and money. Examples: looking for tools, documents that cannot be found or are stored in a place that is located far away from the work floor (records kept in the basement).
Over processing
It is expensive when too many steps must be taken to process a product. Therefore it is important to asses in advance what the customer requires and to adjust the processing method to match this.
Skills in Value Stream Mapping
The key elements in a LEAN Manufacturing organization are the employees. This is why it is important to use their skills in the best possible way and in the right place. If this does not happen, waste exists.
Tips for using Value Stream Mapping in practice
Here are some tips for effectively applying Value Stream Mapping (VSM) to improve your processes:
Define the objective in Value Stream Mapping
Clearly determine the purpose of the VSM analysis, such as identifying waste, reducing lead times, optimizing product flow, or improving customer satisfaction. By defining the objective, you can align your efforts with the desired outcome.
Map the current state
Create a detailed process map that visualizes the current state of your operations, including process steps, material and information flow, and lead times. Ensure to involve team members in documenting and understanding the current process.
Identify waste
Analyze the process map to identify and eliminate waste, such as overproduction, waiting times, unnecessary movements, and defects. Engage team members in identifying areas for improvement and brainstorming solutions.
Develop a future state map
Collaborate with team members to design a future state map that represents the ideal process flow based on lean management principles and customer demand. Visualize how the product flow and material and information flow should be optimized to meet customer requirements.
Implement improvements
Create an action plan to implement the identified improvements. Assign responsibilities to team members and track the progress of implementation. Regularly review and refine the process to ensure continuous improvement.
By following these steps, you can leverage Value Stream Mapping to streamline your operations, eliminate waste, and meet customer demands more effectively.
Advantages of Value Stream Mapping
As VSM provides a good insight into waste, an organization can cater for the customer’s needs and requirements in a much better way.It quickly becomes clear how the business processes work.
As the focus is on the team, there is a common element of involvement resulting in a better communication. A VSM is a starting point for improvement projects in which an overview is created of the lead time, processing time and recovery time.
Summary Value Stream Mapping (VSM)
Value Stream Mapping (VSM), within the Lean methodology, is a powerful approach to analyze the current state of a production or business process and identify improvements. The implementation plan of VSM involves mapping the flow of products and information through the process, including the various process steps and their corresponding lead times.
For a successful VSM analysis, a team works collaboratively. Each team member contributes to creating a detailed process map that visualizes the current situation and highlights the different process steps, from raw material to final product. Identifying waste and inefficiencies within the stream analysis helps uncover opportunities for process improvements.
Data boxes are used to gather and display important information about the different process steps. These data help measure lead times, processing times, and other relevant performance indicators. Collecting this data is crucial for identifying bottlenecks and developing improvement strategies.
Value Stream Mapping provides a structured approach to understand and optimize the value stream within an organization. By implementing VSM, organizations can gain insights into their current processes, address inefficiencies, and ultimately strive for improved workflow and increased customer satisfaction.

It’s Your Turn
What do you think? Is Value Stream Mapping applicable in today’s modern (production) companies? Do you recognize the practical explanation or do you have more additions? What are your success factors for the good VSM exercise?
Share your experience and knowledge in the comments box below.
More information
- Abdulmalek, F. A. & Rajgopal, J. (2007). Analyzing the benefits of lean manufacturing and value stream mapping via simulation: a process sector case study. International Journal of production economics, 107(1), 223-236.
- Hines, P. & Rich, N. (1997). The seven value stream mapping tools. International journal of operations & production management, 17(1), 46-64.
- Rother, M. & Shook, J. (2003). Learning to see: value stream mapping to add value and eliminate muda. Lean Enterprise Institute.
- Seth, D. & Gupta, V. (2005). Application of value stream mapping for lean operations and cycle time reduction: an Indian case study. Production Planning & Control, 16(1), 44-59.
How to cite this article:
Mulder, P. (2013). Value Stream Mapping (VSM). Retrieved [insert date] from Toolshero: https://www.toolshero.com/problem-solving/value-stream-mapping-vsm/
Original publication date: 09/14/2013 | Last update: 08/09/2023
Add a link to this page on your website:
<a href=”https://www.toolshero.com/problem-solving/value-stream-mapping-vsm/”> Toolshero: Value Stream Mapping (VSM)</a>
Related ARTICLES

DMADV Process: the Basics and Steps

Six Thinking Hats Technique explained

Charles Kepner biography and books

Eight Dimensions of Quality by David Garvin

Agile Crystal Method explained