Bivariate Analysis in Research explained

Bivariate Analysis: this article explains bivariate analysis in a practical way. The article starts with the definition of this tool, followed by an explanation of the differences between univariate and bivariate analysis and a practical example. You will also find information about the different types of bivariate analysis. Enjoy reading!
What is a bivariate analysis?
A bivariate analysis is a statistical method of examining the relationship between two variables. This tool helps researchers establish correlations between two variables and provides insight into the strength and direction of the correlation.
This analysis is very useful for researchers conducting studies in various fields such as social sciences, medicine, marketing and more.

Understanding bivariate analysis allows students to effectively analyze data for research such as a thesis and draw informed conclusions. This article explores the concept of bivariate analysis and discusses its benefits, as well as different types of analysis with easy-to-understand explanations and recognizable, practical examples.
Why is a bivariate analysis important?
Bivariate analyzes are of great importance in statistical research. Let’s look at some key reasons why it’s valuable:
Identifying trends and patterns
The bivariate analysis helps researchers discover hidden trends and patterns by assessing the relationship between two variables. This in contrast of the Univariate Analysis which only looks at one variable.
By examining the data, researchers can learn to understand how changes in one variable correspond to changes in another, yielding valuable insights.
Example: Marketing research can use bivariate analysis to understand the relationship between advertising spend and sales. By analyzing the data, researchers can identify patterns that indicate whether an increase in advertising spending is indeed leading to higher sales.
Determining cause-and-effect relationships
Bivariate analysis allows researchers to assess whether two variables are statistically associated with each other, helping to establish cause-and-effect relationships.
It helps determine whether changes in one variable lead to changes in the other, or whether the relationship is just coincidental.
Example: In a medical study, bivariate analysis can be used to examine the relationship between smoking and the occurrence of lung cancer.
By analyzing the data, researchers can determine whether there is a significant association between the two variables, indicating a causal relationship.
Making predictions
Bivariate analysis allows researchers to make predictions based on the relationship between two variables. Modeling the relationship allows researchers to predict future outcomes based on changes in the independent variable.
Example: Suppose a researcher wants to investigate the relationship between study time and study results. Through bivariate analysis, the researcher can develop a model that predicts how study outcomes change as study time increases.
Decision-making and the bivariate analysis
Bivariate analysis plays an important role in informing decision-making in various domains such as business, policy and healthcare.
By understanding the relationship between two variables, decision makers can make more informed decisions.
Example: In a business context, bivariate analysis can be used to examine the relationship between pricing and profitability. By analyzing the data, business managers can determine which price levels are most beneficial to the company’s profitability.
Research Methods For Business Students Course
A-Z guide to writing a rockstar Research Paper with a bulletproof Research Methodology!
Types of bivariate analysis
There are several types of bivariate analysis that can be used to examine the relationship between two variables. Here are some of the most common types:
Scatter charts
A scatter chart is a graph that shows how two variables are related. It shows the values of one variable on the x-axis and the values of the other variable on the y-axis. The pattern in the graph shows what kind of relationship there is between the two variables and how strong it is.
Example: A scatter plot can be used to examine the relationship between age and blood pressure. The diagram can show if there is a link between higher age and higher blood pressure.
Correlation analysis
Correlation is a statistical measure that indicates how strongly and in which direction two variables are related. A positive correlation means that when one variable rises, the other rises as well. A negative correlation shows that when one variable rises, the other falls.
Example: Correlation can be used to compare the relationship between the number of hours spent studying and the grades achieved. A positive correlation would mean that the more time spent studying, the higher the grades.
Regression analysis
This form of analysis gives access to various tools to identify potential relationships between data points. It can also provide the equation of the curve or line as well as the correlation coefficient.
Example: Regression analysis can be used to examine the relationship between the selling price of a home and factors such as home size, number of bedrooms, and so on. It can help predict the selling price based on these variables.
Chi-square test
The chi-square test is a statistical method to identify differences in one or more categories between the expected and observed values. Researchers use this statistical test to compare and validate categorical variables within the same sample group by using contingency tables.
Example: A chi-square test can be used to determine whether there is a significant relationship between gender and political affiliation in a particular population group.
T-Test
A t-test is a statistical test that compares the means of two groups to see if there is a major difference. This analysis is useful when comparing the means of two categories of a categorical variable.
Example: A t-test can be used to determine if there is a significant difference in the mean scores of men and women on a given test.
Step-by-step plan for performing a bivariate analysis
When performing a bivariate analysis, there are some practical steps you can follow.
Here’s a concise, simple explanation of these steps:
Step 1: Collect data
Collect data from the two variables you want to analyze. Make sure you have enough data to get a reliable result.
Step 2: Create graphics to make up a bivariate analysis
Create a scatter plot to visualize the relationship between the two variables. Place the values of one variable on the x-axis and the values of the other variable on the y-axis. Each point on the scatter plot represents a pair of data.
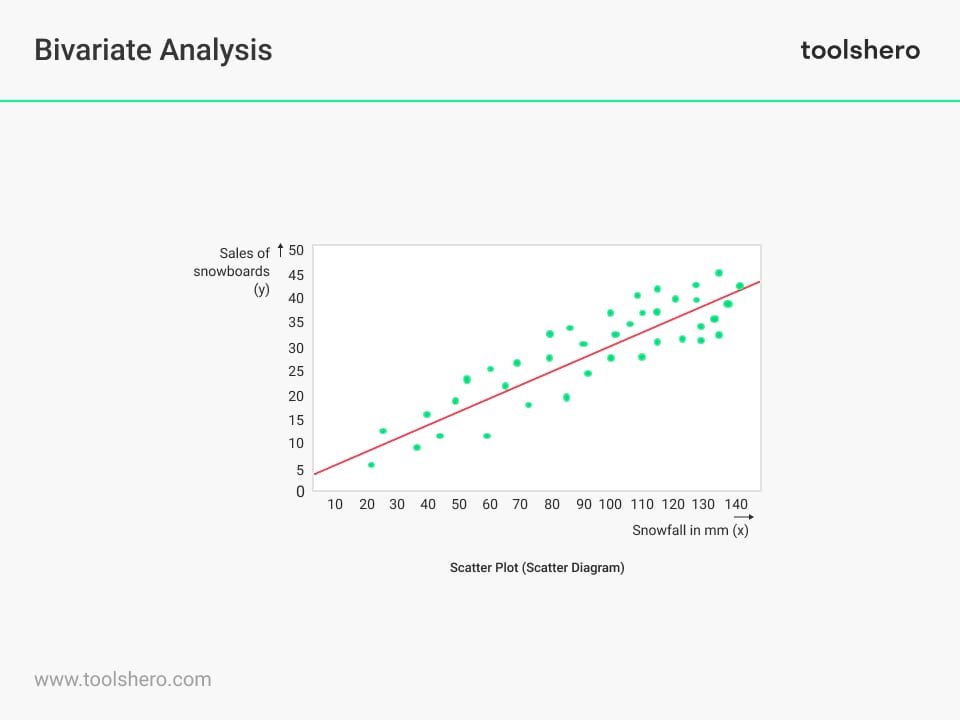
Figure 1 – an example of a Bivariate Analysis
Step 3: Assess correlation
Look at the patterns on the scatter plot to determine if there is a correlation between the variables. If the points on the scatter plot show an upward trend, there is a positive correlation. If the points show a downward trend, then there is a negative correlation. If there is no clear pattern, there may be no correlation.
Step 4: Apply statistical methods
If you want to know how strong the correlation is, you can calculate a correlation coefficient. The most commonly used correlation coefficient is the so-called Pearson correlation coefficient.
It varies between -1 and +1, with a value of +1 indicating a perfect positive correlation, a value of -1 indicating a perfect negative correlation, and a value of 0 indicating no correlation.
Step 5: Interpret results
Based on the correlation coefficient, you can draw conclusions about the strength and direction of the relationship between the variables. A higher absolute value of the correlation coefficient indicates a stronger correlation. Note: correlation does not always imply causation, so be careful when drawing causal conclusions.
Bivariate Analysis: correlation versus causality
Imagine looking outside one day and seeing that it is raining heavily. You notice that many people walk around outside with umbrellas open. This is an example of correlation. It seems that when it rains, people use umbrellas.
But does this mean that using an umbrella will cause it to rain? Or that rain always causes people to open umbrellas? No, that’s not the case.
Using an umbrella is a response to the rain. People open their umbrellas to keep themselves dry when it rains.
This example shows that there is a correlation between rain and the use of umbrellas. But it does not mean that using an umbrella can cause rain. It is important to understand that correlation is not the same as causation as it does not prove that one is the cause of the other.
Further research is needed to determine whether there is causality. Other factors must be considered and different situations must be looked at to understand whether using an umbrella can actually cause the rain. In this particular case, we know it’s not possible.

Now it’s your turn
What do you think? Do you recognize the explanation about the bivariate analysis? Before reading this article, had you ever heard of bivariate analysis? If so, in what context? Have you ever performed a bivariate analysis? Which graphical methods do you know to show the relationship between two variables? Do you have tips or comments?
Share your experience and knowledge in the comments box below.
More information
- Barick, R. (2021). Research Methods For Business Students. Retrieved 02/16/2024 from Udemy.
- Bertani, A., Di Paola, G., Russo, E., & Tuzzolino, F. (2018). How to describe bivariate data. Journal of thoracic disease, 10(2), 1133.
- Verhoeven, N. (2007). Doing research. The Hows and Whys of Applied Research. Pocket Guide to Social Work.
- Dowdy, S., Wearden, S., & Chilko, D. (2011). Statistics for research. John Wiley & Sons.
How to cite this article:
Janse, B. (2023). Bivariate Analysis. Retrieved [insert date] from Toolshero: https://www.toolshero.com/research/bivariate-analysis/
Original publication date: 10/30/2023 | Last update: 03/22/2024
Add a link to this page on your website:
<a href=” https://www.toolshero.com/research/bivariate-analysis/”> Toolshero: Bivariate Analysis</a>
Ben Janse
Ben Janse is a young professional working at ToolsHero as Content Manager. He is also an International Business student at Rotterdam Business School where he focusses on analyzing and developing management models. Thanks to his theoretical and practical knowledge, he knows how to distinguish main- and side issues and to make the essence of each article clearly visible.

Related ARTICLES

Respondents: the definition, meaning and the recruitment


Gartner Magic Quadrant report and basics explained

Univariate Analysis: basic theory and example

Contingency Table: the Theory and an Example