Contingency Table: the Theory and an Example

Contingency table: this article explains the concept of a contingency table, also known as a crosstab or cross tabulation, in a practical way. The article includes a definition and general explanation of this analytical method, followed by a description of the advantages of this method. You will also find a practical step-by-step plan with several examples to get you started with running your own contingency table. Enjoy reading!
What is a contingency table?
Businesses are built on numbers. Whether it’s profit numbers, sales metrics, or customer satisfaction scores like NPS, numbers are critical to understanding a company’s performance. Numbers are also at the basis of almost every well-considered decision.
But what if numbers don’t provide enough insights? What if the relationship between different numbers is unclear and managers want to understand how different variables affect each other? How can statistics help?

That’s where crosstabs come into play. Crosstabs are also known as cross tabulation or contingency table analysis. It is a valuable tool that enables researchers to compare the results of one or more variables and discover meaningful patterns and insights.
Contingency table definition
A contingency table, or crosstab, is a table of data that presents the results of, for example, an entire group of survey respondents and subgroups. The crosstab is used with data on a nominal scale, where the variables are named or labeled without any particular order.
Rather than just looking at overall survey results, crosstabs allow researchers to explore relationships between data that are otherwise not easily visible.
In the crosstab below you can see the distribution of respondents’ preferences.
For example, there are 20 respondents who prefer soft drink A in combination with snack X, while there are 25 respondents who prefer soft drink B in combination with snack Y.
Analyzing this crosstab can help you understand possible relationships between soft drink and snack preferences. For example, you can see if there is a preference for certain combinations of soft drinks and snacks or if the preferences are more or less random.
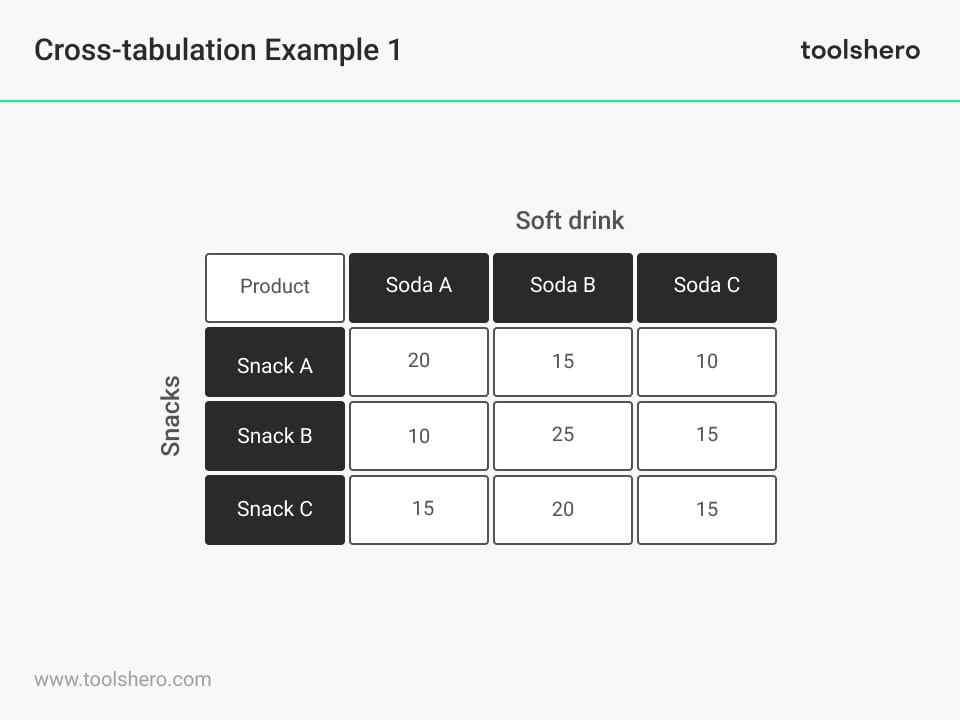
Figure 1 – Cross Tabulation example
Benefits of contingency tables
Below you will find why contingency tables are of great value to many researchers when doing research.
Reduced confusion
Analyzing large datasets can be tricky. Finding relevant, actionable insights within large amounts of data is even more complicated. Contingency tables simplify and divide data into subgroups for easier interpretation.
They show percentages and frequencies that can change when compared to variables in other categories. By making datasets manageable in this way, fewer errors are made.
Detailed data points
Contingency tables allow you to examine the relationships between one or more variables, leading to insights at a more detailed level. These insights could otherwise go unnoticed in a sea of data or require additional work to reveal them.
Actionable insights
Cross tabulation simplifies datasets, allowing you to make quick comparisons between different data. This means you can get insights faster to create new marketing strategies based on the data.
Research Methods For Business Students Course
A-Z guide to writing a rockstar Research Paper with a bulletproof Research Methodology!
Better interpretation
When you use crosstabs, datasets are simplified and broken down into subgroups. The resulting clean data is in a more understandable format and can be easily viewed and used by researchers and team members without extensive analytical training.
Can I use a contingency table for all data?
Now that you understand the benefits of contingency tables, it’s important to understand when to use them.
Crosstabs are normally used when processing information that can be divided into mutually exclusive groups, known as categorical variables.
They allow the researcher to explore relationships within the data that may not be immediately obvious.
For example, a crosstab report can show the connection between two or more survey questions from a market research study. (see example)
Various industries and positions use crosstabs. HR departments can use crosstabs to examine employee survey data about company culture, leadership guidance, employee engagement, and more.
Marketing research teams can use crosstabs to make raw data more accessible for management decision making.
Customer service teams can use crosstabs to evaluate customer satisfaction between long-term customers and new customers.
School boards can take instructor evaluation data from students and cross-tabulate it with subject, class time, and other data to improve the educational experience for students.
How do I use a contingency table for my thesis?
Contingency tables are a valuable resource for students writing a thesis. When conducting research, it is often necessary to analyze data and find relationships between different variables.
Cross-tabulations provide a structured and clear way to examine these relationships.
For students with thesis assignments, crosstabs allow them to extract key insights from their data and provide supporting evidence for their research questions.
Whether exploring the relationship between demographics and opinions, comparing different groups of respondents, or analyzing the impact of different factors, crosstabs can help students identify patterns, trends, and significant relationships in their data.
Using crosstabs also allows students to visually present the results of their research. Graphical representations such as bar graphs, line graphs or heat maps can make the findings easier to understand and communicate.
This is especially valuable when writing the results and discussion sections of a thesis, where students need to share insights gained and support their conclusions.
Step-by-step plan for creating and interpreting a contingency table
The steps to follow to create and interpret a contingency table are explained below. You will find a practical example for every step.
Imagine that you have conducted a survey among students to find out their opinion about two different study programs (A and B). You have collected data from 120 respondents and now want to create a crosstab to analyze the relationship between the study programs and student satisfaction.
Step 1: collecting and organizing data
Before you can create a contingency table, it’s important to collect relevant data. Make sure you have enough data for the variables you want to analyze.
Organize your data in a structured way, assigning each observation to the correct categories of the variables.
Example: You collected the survey results, where each respondent was assigned to a category of program A or B. You also have a variable for student satisfaction, where each respondent gave a score of 1-5. You organize this data in a table with two columns: one for the study program and one for the satisfaction score.
Step 2: creating a contingency table
To create a contingency table, place one variable in the rows of the table and the other variable in the columns.
Count the number of observations corresponding to each combination of categories and complete the table accordingly. You can also add percentages or averages to better understand the distribution of the data.
You create a contingency table where the columns represent programs A and B and the rows contain satisfaction scores 1-5. You count the number of respondents that fall into each category. The resulting crosstab looks like this:
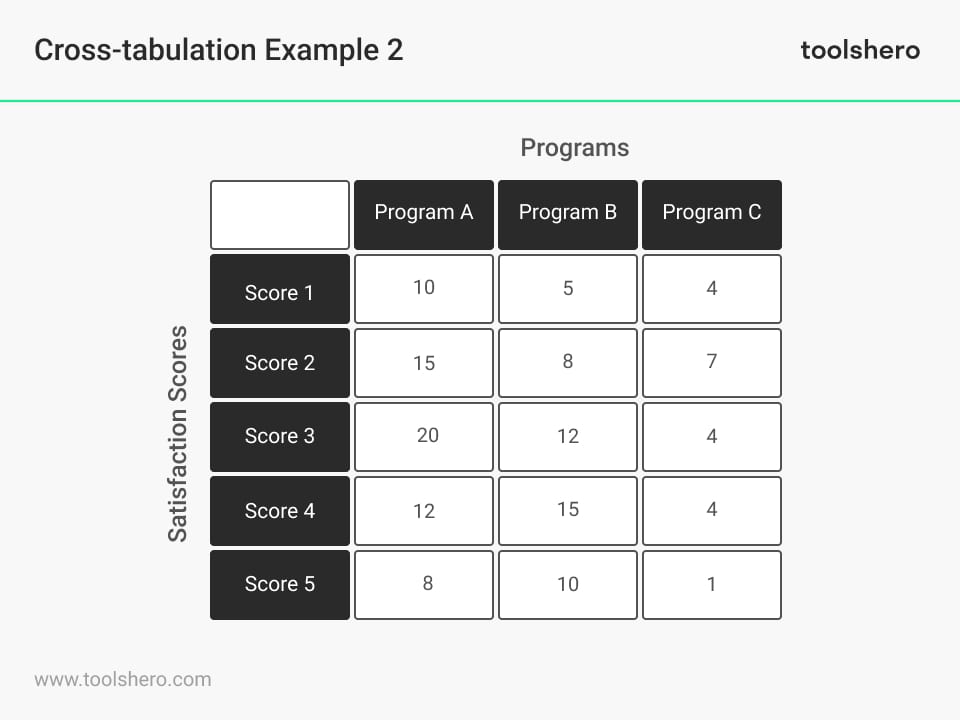
Figure 2 – Cross Tabulation example
Step 3: interpreting the results
When interpreting the results of a crosstab, it’s important to note the proportions and patterns that appear.
Look for noticeable differences between the categories and look for any trends or dependencies. You can also perform statistical tests, such as the chi-square test, to determine whether the observed differences are statistically significant. The chi-square test is explained below.
When interpreting the results, it is also important to consider the context of your research and the specific questions you are trying to answer. Use the crosstab to gain insight into the relationship between the variables and support your conclusions with the findings from the table.
When interpreting the results of our example, you can see that there are differences in the satisfaction scores between the two study programmes.
For example, program A has more respondents with a satisfaction score of 3, while program B has more respondents with a satisfaction score of 4. This gives a first indication of possible differences in satisfaction between the two programs.
Chi-square test
The chi-square test is a statistical test used to determine whether there is a significant relationship between two categorical variables in a data set.
It cross-tabulates the observed frequencies with the expected frequencies based on a null hypothesis that there is no relationship between the variables.
When performing the chi-square test, a calculated chi-square value is obtained. If this value is significant (i.e., greater than a critical value), it indicates that there is a significant relationship between the variables.
This means that the observed frequencies in the contingency table deviate from what you would expect based on chance.
Example
You want to know whether there is a significant relationship between gender and career choice. You perform a chi-square test to investigate this.
The calculated chi-square value from the test is 10.0. Compare this to a critical value, which depends on the desired reliability and the number of degrees of freedom. Suppose the critical value, at a confidence level of 0.05 and with 1 degree of freedom, is 3.84.
Since the calculated chi-squared value (10.0) is larger than the critical value (3.84), we can conclude that there is a significant relationship between gender and occupational choice in our sample. This means that the distribution of occupational choice is not equal for men and women.
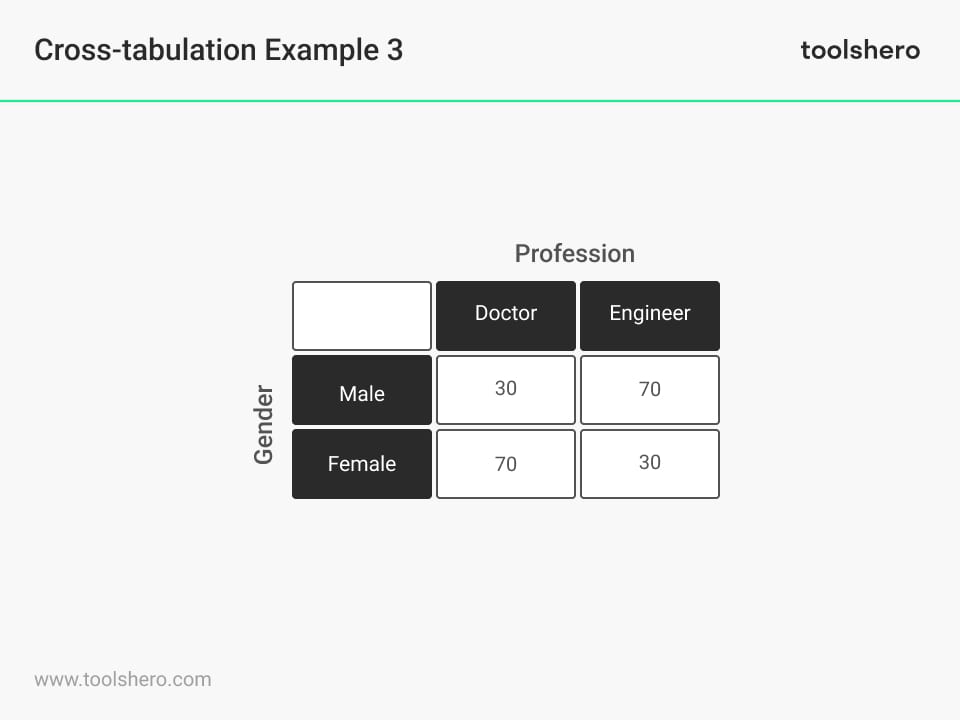
Figure 3 – Cross Tabulation example

Now it’s your turn
What do you think? Do you recognize the explanation about the contingency table? Do you have experience making these tables? Have you heard about crosstabs and their applications before? What benefits do you see in using cross-tabulations? Can you think of a specific scenario where you could apply the contingency table in real life? Do you have tips or other comments?
Share your experience and knowledge in the comments box below.
More information
- Barick, R. (2021). Research Methods For Business Students. Retrieved 02/16/2024 from Udemy.
- Dass, M. (2010). Cross‐Tabulation. Wiley International Encyclopedia of Marketing.
- Kamakura, W. A., & Wedel, M. (1997). Statistical data fusion for cross-tabulation. Journal of Marketing Research, 34(4), 485-498.
- Yin, C., Hirokawa, S., Yau, J. Y. K., Hashimoto, K., Tabata, Y., & Nakatoh, T. (2013). Research trends with cross tabulation search engine. International Journal of Distance Education Technologies (IJDET), 11(1), 31-44.
How to cite this article:
Janse, B. (2023). Contingency Table Theory. Retrieved [insert date] from Toolshero: https://www.toolshero.com/research/contingency-table/
Original publication date: 02/16/2024 | Last update: 04/11/2024
Add a link to this page on your website:
<a href=” https://www.toolshero.com/research/contingency-table/”> Toolshero: Contingency Table Theory</a>
Ben Janse
Ben Janse is a young professional working at ToolsHero as Content Manager. He is also an International Business student at Rotterdam Business School where he focusses on analyzing and developing management models. Thanks to his theoretical and practical knowledge, he knows how to distinguish main- and side issues and to make the essence of each article clearly visible.

Related ARTICLES

Respondents: the definition, meaning and the recruitment


Gartner Magic Quadrant report and basics explained

Univariate Analysis: basic theory and example

Bivariate Analysis in Research explained