Univariate Analysis: basic theory and example

Univariate analysis: this article explains univariate analysis in a practical way. The article begins with a general explanation and an explanation of the reasons for applying this method in research, followed by the definition of the term and a graphical representation of the different ways of representing univariate statistics. Enjoy the read!
Introduction
Research is a dynamic process that carefully uses different techniques and methods to gain insights, validate hypotheses and make informed decisions.
Using a variety of analytical methods, researchers can gain a thorough understanding of their data, revealing patterns, trends, and relationships.

One of the main approaches or methods for research is the univariate analysis, which provides valuable insights into individual variables and their characteristics.
In this article, we dive into the world of univariate analysis, its definition, importance and applications in research.
Techniques and methods in research
Research methodologies encompass a wide variety of techniques and methods that help researchers extract meaningful information from their data. Some common approaches are:
Descriptive statistics
Summarizing data using measures such as mean, median, mode, variance, and standard deviation.
Inferential statistics
Drawing conclusions about a broader population based on a sample. Methods such as hypothesis testing and confidence intervals are used for this.
Multivariate analysis
Exploring relationships between multiple variables simultaneously, allowing researchers to explore complex interactions and dependencies. A bivariate analysis is when the relationship between two variables is explored.
Qualitative analysis
Discovering insights and trying to understand subjective type of data, such as interviews, observations and case studies.
Quantitative analysis
Analyzing numerical data using statistical methods to reveal patterns and trends.
What is univariate analysis?
Univariate analysis focuses on the study and interpretation of only one variable on its own, without considering possible relationships with other variables.
The method aims to understand the characteristics and behavior of that specific variable. Univariate analysis is the simplest form of analyzing data.
Definition of univariate
The term univariate consists of two elements: uni, which means one, and variate, which refers to a statistical variable. Therefore, univariate analysis focuses on exploring and summarizing the properties of one variable independently.
Importance of univariate analysis
Univariate analysis serves as an important first step in many research projects, as it provides essential insights and lays a foundation for further research. It offers researchers the following benefits:
Data exploration
Univariate analysis allows researchers to understand the distribution, central tendency, and variability of a variable.
Identification of outliers
By detecting anomalous values, univariate analysis helps identify outliers that require further investigation or treatment during the data analysis phase.
Data cleaning
Univariate analysis helps identify missing data, inconsistencies or errors within a variable, allowing researchers to refine and optimize their data set before moving on to more complex analyses.
Variable selection
Researchers can use the univariate analysis to determine which variables are most promising for further research. This enables efficient allocation of resources and hypothesis testing.
Reporting and visualization
Summarizing and visualizing univariate statistics facilitates clear and concise reporting of research results. This makes complex data more accessible to a wider audience.
Research Methods For Business Students Course
A-Z guide to writing a rockstar Research Paper with a bulletproof Research Methodology!
Applications of univariate analysis
Univariate analysis is used in various research areas and disciplines. It is often used in:
- Epidemiological studies to analyze risk factors
- Social science research to investigate attitudes, behaviors or socio-economic variables
- Market research to understand consumer preferences, buying patterns or market trends
- Environmental studies to investigate pollution, climate data or species distributions
By using univariate analysis, researchers can uncover valuable insights, detect trends, and lay the groundwork for more comprehensive statistical analysis.
Types of univariate analyses
The most common method of performing univariate analysis is summary statistics. The correct statistics are determined by the level of measurement or the nature of the information in the variabels. The following are the most common types of summary statistics:
- Measures of dispersion: these numbers describe how evenly the values are distributed in a dataset. The range, standard deviation, interquartile range, and variance are some examples.
- Range: the difference between the highest and lowest value in a data set.
- Standard deviation: an average measure of the spread.
- Interquartile range: the spread of the middle 50% of the values.
- Measures of central tendency: these numbers describe the location of the center point of a data set or the middle value of the data set. The mean, median and mode are the three main measures of central tendency.
There are several ways to describe patterns found in univariate data. The data can be displayed graphically as well. Some examples:
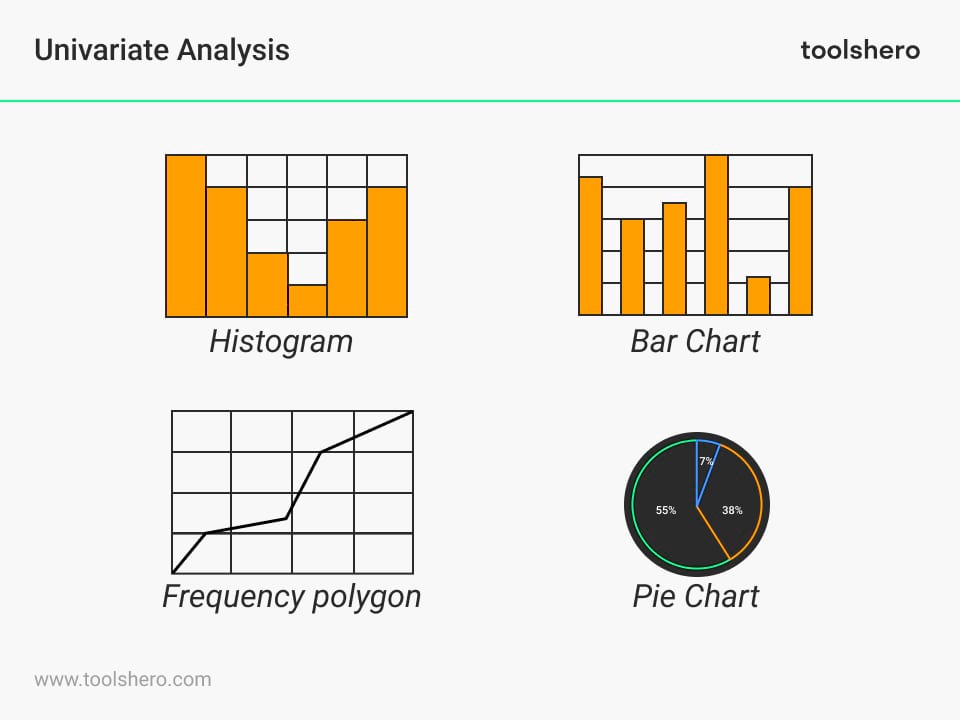
Figure 1. Univariate Analysis – Types
Frequency table
Frequency indicates how often something occurs. The frequency of observation thus indicates the number of times an event occurs.
The frequency distribution table can display qualitative and numerical or quantitative variables. The distribution provides an overview of the data and allows you to spot patterns.
Bar chart
The bar chart is displayed in the form of rectangular bars.
The chart compares different categories. The chart can be plotted vertically or horizontally.
In most cases, the bar is plotted vertically.
The horizontal or x-axis represents the category and the vertical y-axis represents the value of the category.
This diagram can be used, for example, to see which part of a budget is the largest.
Histogram
A histogram is a graph that shows how often certain values occur in a data set. It consists of bars whose height indicates how often a certain value occurs.
Frequency polygon
The frequency polygon is very similar to the histogram. It is used to compare data sets or to display the cumulative frequency distribution.
The frequency polygon is displayed as a line graph.
Pie chart
The pie chart displays the data in a circular format. The diagram is divided into pieces where each piece is proportional to its part of the complete category. So each “pie slice” in the pie chart is a portion of the total. The total of the pieces should always be 100.
Example situation of an Univariate Analysis
An example of univariate analysis might be examining the age of employees in a company.
Data is collected on the age of all employees and then a univariate analysis is performed to understand the characteristics and distribution of this single variable.
We can calculate summary statistics, such as the mean, median, and standard deviation, to get an idea of the central tendency and range of ages.
Histograms can also be used to visualize the frequency of different age groups and to identify any patterns or outliers.
This univariate analysis helps organizations to better understand the age structure of the workforce in the company.

Now it’s your turn
What do you think? Do you recognize the explanation about the univariate analysis? Have you ever heard of univariate analysis? Have you applied it yourself during any of the studies you have conducted? Do you know of any other methods or techniques used in conjunction with univariate analysis? Are you familiar with the visual graphs used in univariate analysis?
Share your experience and knowledge in the comments box below.
More information about the Univariate Analysis
- Barick, R. (2021). Research Methods For Business Students. Retrieved 02/16/2024 from Udemy.
- Dowdy, S., Wearden, S., & Chilko, D. (2011). Statistics for research. John Wiley & Sons.
- Garfield, J., & Ben‐Zvi, D. (2007). How students learn statistics revisited: A current review of research on teaching and learning statistics. International statistical review, 75(3), 372-396.
- Ostle, B. (1963). Statistics in research. Statistics in research., (2nd Ed).
- Wagner III, W. E. (2019). Using IBM® SPSS® statistics for research methods and social science statistics. Sage Publications.
How to cite this article:
Janse, B. (2024). Univariate Analysis. Retrieved [insert date] from Toolshero: https://www.toolshero.com/research/univariate-analysis/
Original publication date: 03/22/2024 | Last update: 03/22/2024
Add a link to this page on your website:
<a href=”https://www.toolshero.com/research/univariate-analysis/”>Toolshero: Univariate Analysis</a>
Ben Janse
Ben Janse is a young professional working at ToolsHero as Content Manager. He is also an International Business student at Rotterdam Business School where he focusses on analyzing and developing management models. Thanks to his theoretical and practical knowledge, he knows how to distinguish main- and side issues and to make the essence of each article clearly visible.

Related ARTICLES

Respondents: the definition, meaning and the recruitment


Gartner Magic Quadrant report and basics explained

Bivariate Analysis in Research explained

Contingency Table: the Theory and an Example