
Gantt Chart explained plus template

Gantt Chart: this article explains the Gantt Chart, developed by Henry Gantt in a practical way. The article starts off with the meaning of the Gantt chart, its history and application in real life You will find several examples and practical tips to start working with a Gantt chart yourself. This article also contains a downloadable and editable Gantt Chart Template. Enjoy reading!
What is a Gantt Chart? The theory
An organization cannot do without planning tools. One of the best known tools is the planning board which visually represents staffing in several activities / individual tasks. The Gantt chart is the precursor of the project planning board and is still used today as an important planning tool.
This project management tool is also know as the Gantt Diagram or Gantt planning board.

History of the Gantt Chart
The chart is named after Henry Gantt. At the beginning of the 20th century, Henry Gantt developed a Chart as a visual aid to chart the planning and progress of complex projects.
At the time it was an innovative concept which was also deployed for the Construction of the Hoover Dam. This project planning tool became more widely known after the Second World War and was also used in the business sector. Today Gantt Charts are more advanced than in the time of its inception.
Today, this method is an indispensable project planning tool and there is also different types of gantt chart software available on the market.
Modern application
The Gantt Chart has kept abreast of time and is no longer written out on large pieces of paper by hand.
Nowadays, there are complex computer programmes that are based on the classical Chart. From simple Excel files to advanced project management software in which it is possible to calculate to the minute when a project will be finished.
Gantt Chart example and dimensions
A planning board only represents two dimensions, such as production resources and time. These are often Work Breakdown Structures (WBS). A multi-dimensional planning is required for more coherent factors.
This type of Chart is used in larger projects. The layout of the planning board and this planning tool are similar but whereas the information on the planning board can be altered time and again, the information on the Chart is permanent. This makes the planning tool less flexible.
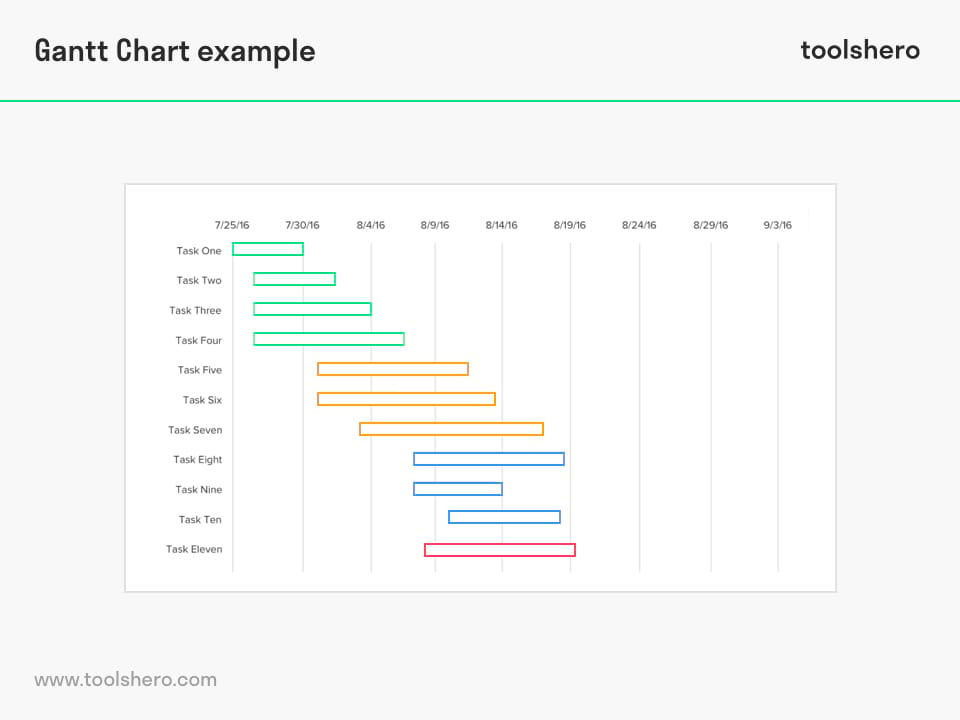
Figure 1 – Example Gantt Chart
Gantt Chart use in project planning
A Gantt chart provides a good understanding of the different activities that run alongside or in succession of each other in a project (tracking project). Therefore, the individual processing times or tasks within a project are represented vertically (vertical axis) and the total project duration is represented on the horizontal bar.
The horizontal bars indicate the start and end date of every task. This way, the chart shows a clear overview of the project planning.
The more complicated the project, the more complicated this planning tool looks. The project planning board becomes more complicated especially when the dependency between the different activities increases. The so-called “milestones” indicate important reference points when certain activities need to have been completed. By using symbols, colours and a simple index, even the most complicated project planning will become easy to read.
When used correctly, the Gantt Chart provides a clear overview of:
- All tasks
- The start and end dates of all tasks
- The duration of all tasks
- The start and end date of the entire project
- Milestones of the project
- The completion date of the project
How to set-up a Gantt Chart? A Step-by-step guide
The use of the Gantt Chart is not limited to simply entering existing data. Project management is a comprehensive discipline, and every project schedule is prepared with the utmost precision.
Create a gantt chart set-up, you can download the Gantt Chart template, follow the steps which are explained below, and develop your own version which can help you manage your project.
Step 1: Work Breakdown Structure (WBS)
When not planned properly, the amount of work at the start of a project can come across as overwhelming. Therefore it is vital to start with the explanation of all the tasks that await the team.
Both in the Project Management Body of Knowledge (PMBOK), as in PRINCE2, the project management process begins with the division of the project into tasks.
These tasks, also seen as work packages, need to take between eight and eighty hours to complete. If the work packages are smaller, it is reasonable to assume that a large overhead will arise.
This has very few advantages, and team members will probably become frustrated quicker. Work packages that are too large are less effective because they are difficult to monitor.
The division of the project into work packages is done using the Work Breakdown Structure (WBS), which not to be confused with the Product Breakdown Structure, or the Organisation Breakdown Structure.
This tool could be seen as the frame of a wooden house. The carpenter needs to work carefully, as many components are dependent on each other. But first, it is key to estimate how much time is needed to successfully carry out each work package.
Step 2: Make an estimate of the duration of all tasks
The horizontal bars which make up the Gantt Chart, represent the duration of a specific work package or task. There are two ways to determine the duration.
Parametric estimation
When using a parametric estimation, the task is compared to standard units. These may stem from personal experiences, but are also often published by different industries. An example is a construction association estimating it takes one hour to place 4 piles.
Analog estimation
When using analog estimation, the task is compared to tasks that have already been completed in the past. An example is a team member mentioning that it took 2 days to prepare a CRM system for changes in the purchasing process.
These two estimation methods can be used in combination with a three-point estimate. For this estimate there is a general formula, namely:
te = (a + m + b) / 3
This means
- te = estimate
- a = optimistic estimate
- m = probable value
- b = pessimistic estimate
This estimation method is a smart way to make both an optimistic and pessimistic estimate. Based on this, a final decision is made.
Even though through the correct application of the WBS and the estimation of work packages significant time can be saved in project execution, the real strength of the Gantt Chart lies in the fact that the project stimulates efficiency.
This means, the ability to run certain tasks simultaneously, schedule project resources, and set the project completion date as soon as possible. This is where dependencies between tasks becomes important.
Step 3: Identify dependencies
There are four types of dependencies between different tasks. These dependencies are displayed with an arrow from one task to another, depending on the complexity of the Gantt Chart. There are four types of dependencies are:
Finish to Start
This is probably the most common dependency between tasks. Finish to Start means that task A needs to be completed before the team can start on task B.
Finish to Finish
A Finish to Finish dependency means that task A needs to be completed before task B can be completed.
Start to Start
Start to Start means that task A needs to be started in order to start task B.
Start to Finish
Start to Finish means that task A needs to be started before task B can be completed. The dependencies identified during this step are added to the Work Breakdown Structure (WBS), so that it is clear at all times which tasks are dependent on each other during the project. When done right, high level project planning can be achieved.
There is also another way the Gantt Chart can be beneficial. It is possible that some tasks can be performed parallel to other tasks, which would ensure time saving. To find out if this is possible, the network diagram is used.
Step 4: Add restrictions
Restrictions determine the level of flexibility that exists for scheduling or rescheduling tasks, by imposing restrictions on the start or finish date. The following restrictions are used:
- As Soon As Possible (ASAP)
- As Late As Possible (ALAP)
- Start No Earlier Than (SNET)
- Start No Later Than (SNLT)
- Finish No Early Than (FNET)
- Finish No Later Than (FNLT)
- Must Start On (MSO)
Step 5: Develop a network diagram
Now that it has been determined which tasks are dependent on each other, it is important to assess the order in which the tasks are performed. This can not be done based on the Gantt Chart alone. Two concepts are important.
Critical Path
The critical path of a project consists out of a series of tasks which determine the completion date of a project. If a specific task needs more time than expected, the completion time of the project if prolonged with the same amount of time.
Float/ Slack
Float, also called Slack, is the amount of time a task can ultimately be delayed without influencing the expected completion date. Float or slack does not exist for a critical path.
In order to create network diagrams, every task needs to be provided with the following information:
- Duration. This is the previously calculated task duration, and counts as the primary input in the process.
- Early Start (ES). This is the earliest possible date a specific task can be started.
- Late Start (LS). This is the latest possible date a specific task can be started.
- Early Finish (EF). This is the earliest possible date a specific task can be completed.
- Late Finish (LF). This is the latest possible date a specific task can be completed.
- Float (FLOAT). This is the maximum duration with which a task can be moved, without influencing the completion date.
Step 6: Make a Gantt Chart
The previously developed network diagram, will show exactly where the start and end dates of every task can be placed on the Gantt Chart. When done right, the start date should be between ES and LS. The end dates will be between EF and LF. Tasks without float will be executed on the critical path.
The Gantt Chart seems to be complete now, but misses one vital aspect: resource conflicts. The Gantt Chart does not take into account the availability or effectiveness of used resources.
Therefore it could occur that a task is delayed because the project manager did not take the time for the maintenance of equipment into account. This is why resource levelling is important.
Step 7: Resource Levelling
One of the Gantt Chart’s weaknesses is the fact that the management of resources needed to execute the project, are not integrated. Imagine it takes a truck 32 hours to complete a certain task, 3 days will be entered into the Gantt Chart. However, it could be that the truck is also used for other tasks, or the complete process could become much more efficient and/ or cheaper.
When using the Gantt Chart, this constantly needs to be taken into account. Using software, it is possible to enter resources for the different tasks.
The software will in turn let the managers know when resources become overloaded. The project manager always keeps an eye on the graph in order to maximise the efficiency of the use of resources.
Advantages of using a Gantt Chart
A good and clearly readable chart gives both a clear overview of the progress of a project and provides clarity for the employees.
They can monitor the progress of a project and the various activities and sub-tasks independently so that they will know exactly where obstacles present themselves.
Consequently, this project planning board is also used as a management tool. The fact that other users can also examine the planning is also considered to be a great advantage of the electronic Gantt Chart.
Gantt Chart Template in Excel
Start describing the different aspects of the Gantt Chart with this ready to use Gantt Chart template (Excel).
Download the Gantt Chart excel template
This template is exclusively for our paying Toolshero members. Click here to see if a membership is something for you!
It’s Your Turn
What do you think? Are you familiar with the Gantt Chart tool? Do you recognize the practical explanation mentioned above or do you have more additional information which you would like to share? What are your success factors for the good project planning set up?
Share your experience and knowledge in the comments box below.
More information
- Clark, W. (2015, 1922). The Gantt chart: A working tool of management. Cornell University Library.
- Kumar, P. P. (2005). Effective use of Gantt chart for managing large scale projects. Cost engineering, 47(7), 14-21.
How to cite this article:
Mulder, P. (2018). Gantt Chart. Retrieved [insert date] from Toolshero: https://www.toolshero.com/project-management/gantt-chart/
Original publication date: 07/03/2018 | Last update: 12/13/2023
Add a link to this page on your website:
<a href=”https://www.toolshero.com/project-management/gantt-chart/”>Toolshero: Gantt Chart</a>
Ben Janse
Ben Janse is a young professional working at ToolsHero as Content Manager. He is also an International Business student at Rotterdam Business School where he focusses on analyzing and developing management models. Thanks to his theoretical and practical knowledge, he knows how to distinguish main- and side issues and to make the essence of each article clearly visible.

Related ARTICLES

Agile Method of Software Development

Project budget explained: theory and a template

Responsibility Assignment Matrix (RAM)

Business Requirements Analysis Framework and Steps

Stakeholder Management: Theory and Strategy


One response to “Gantt Chart explained plus template”
the content was exactly as i want and it helps me a lot and especially the picture. thank you so much.